
[🧠] Sapien Fusion Deep Dive | February 16, 2026
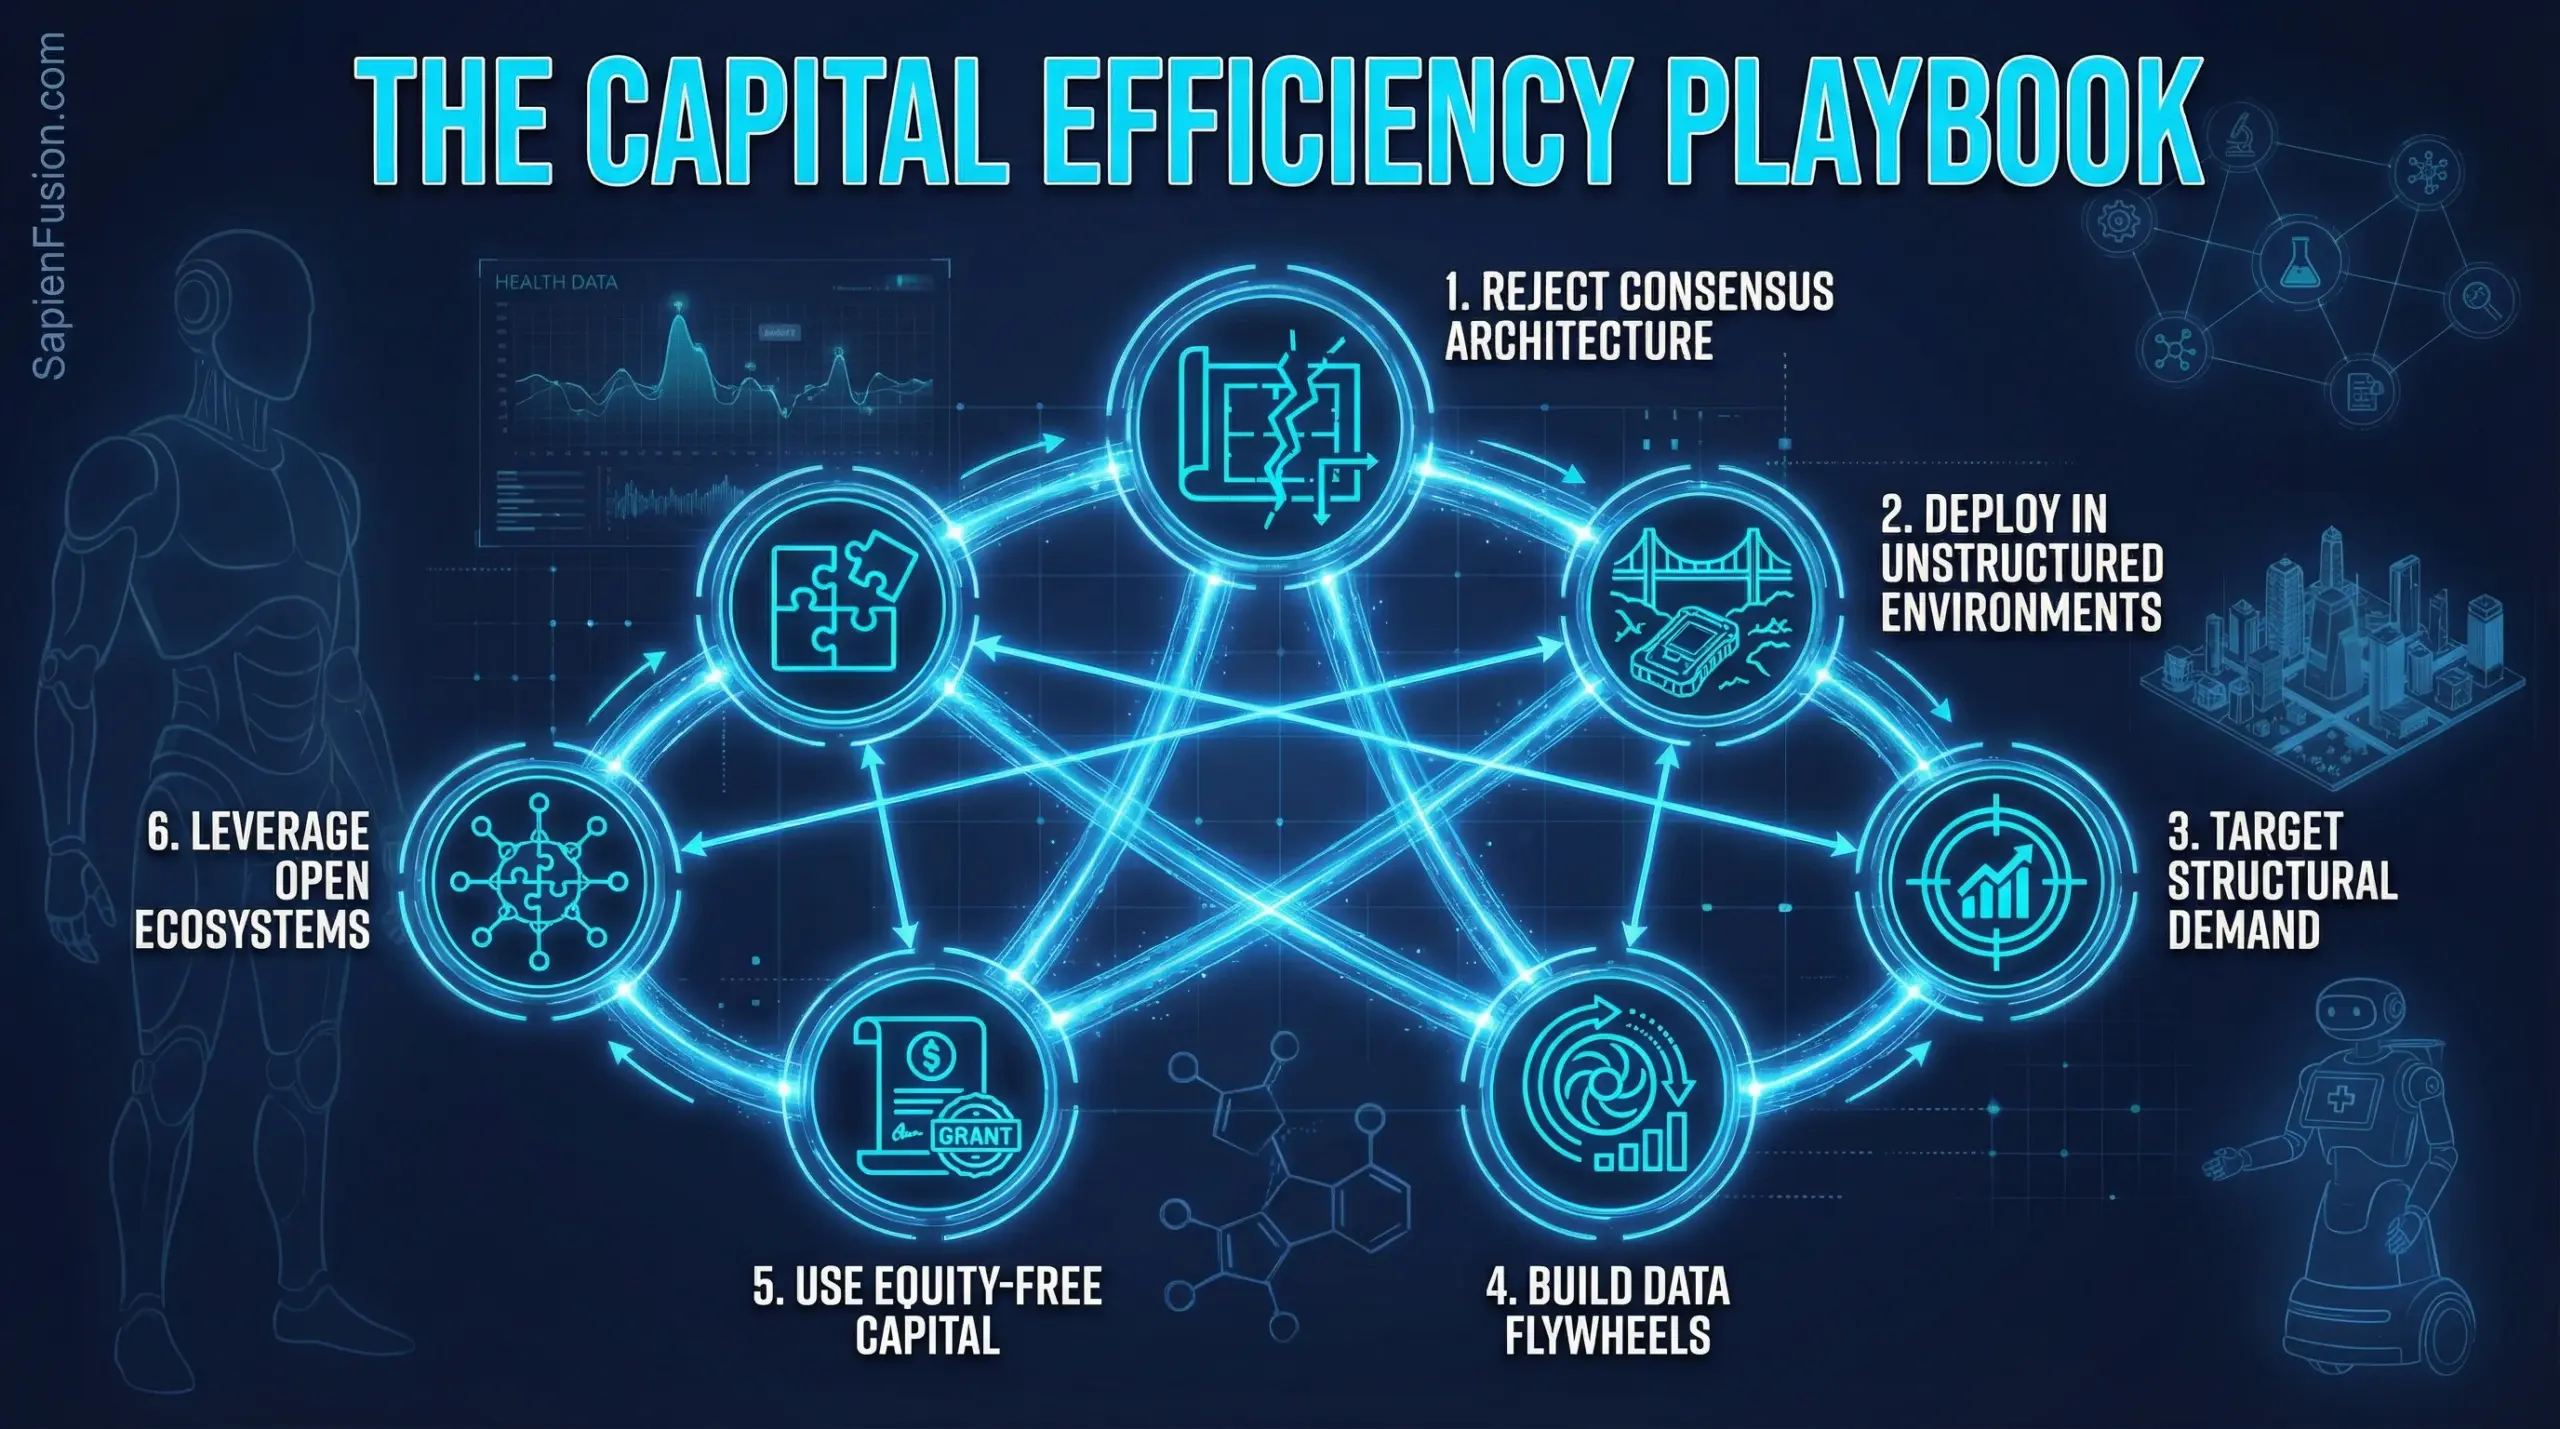
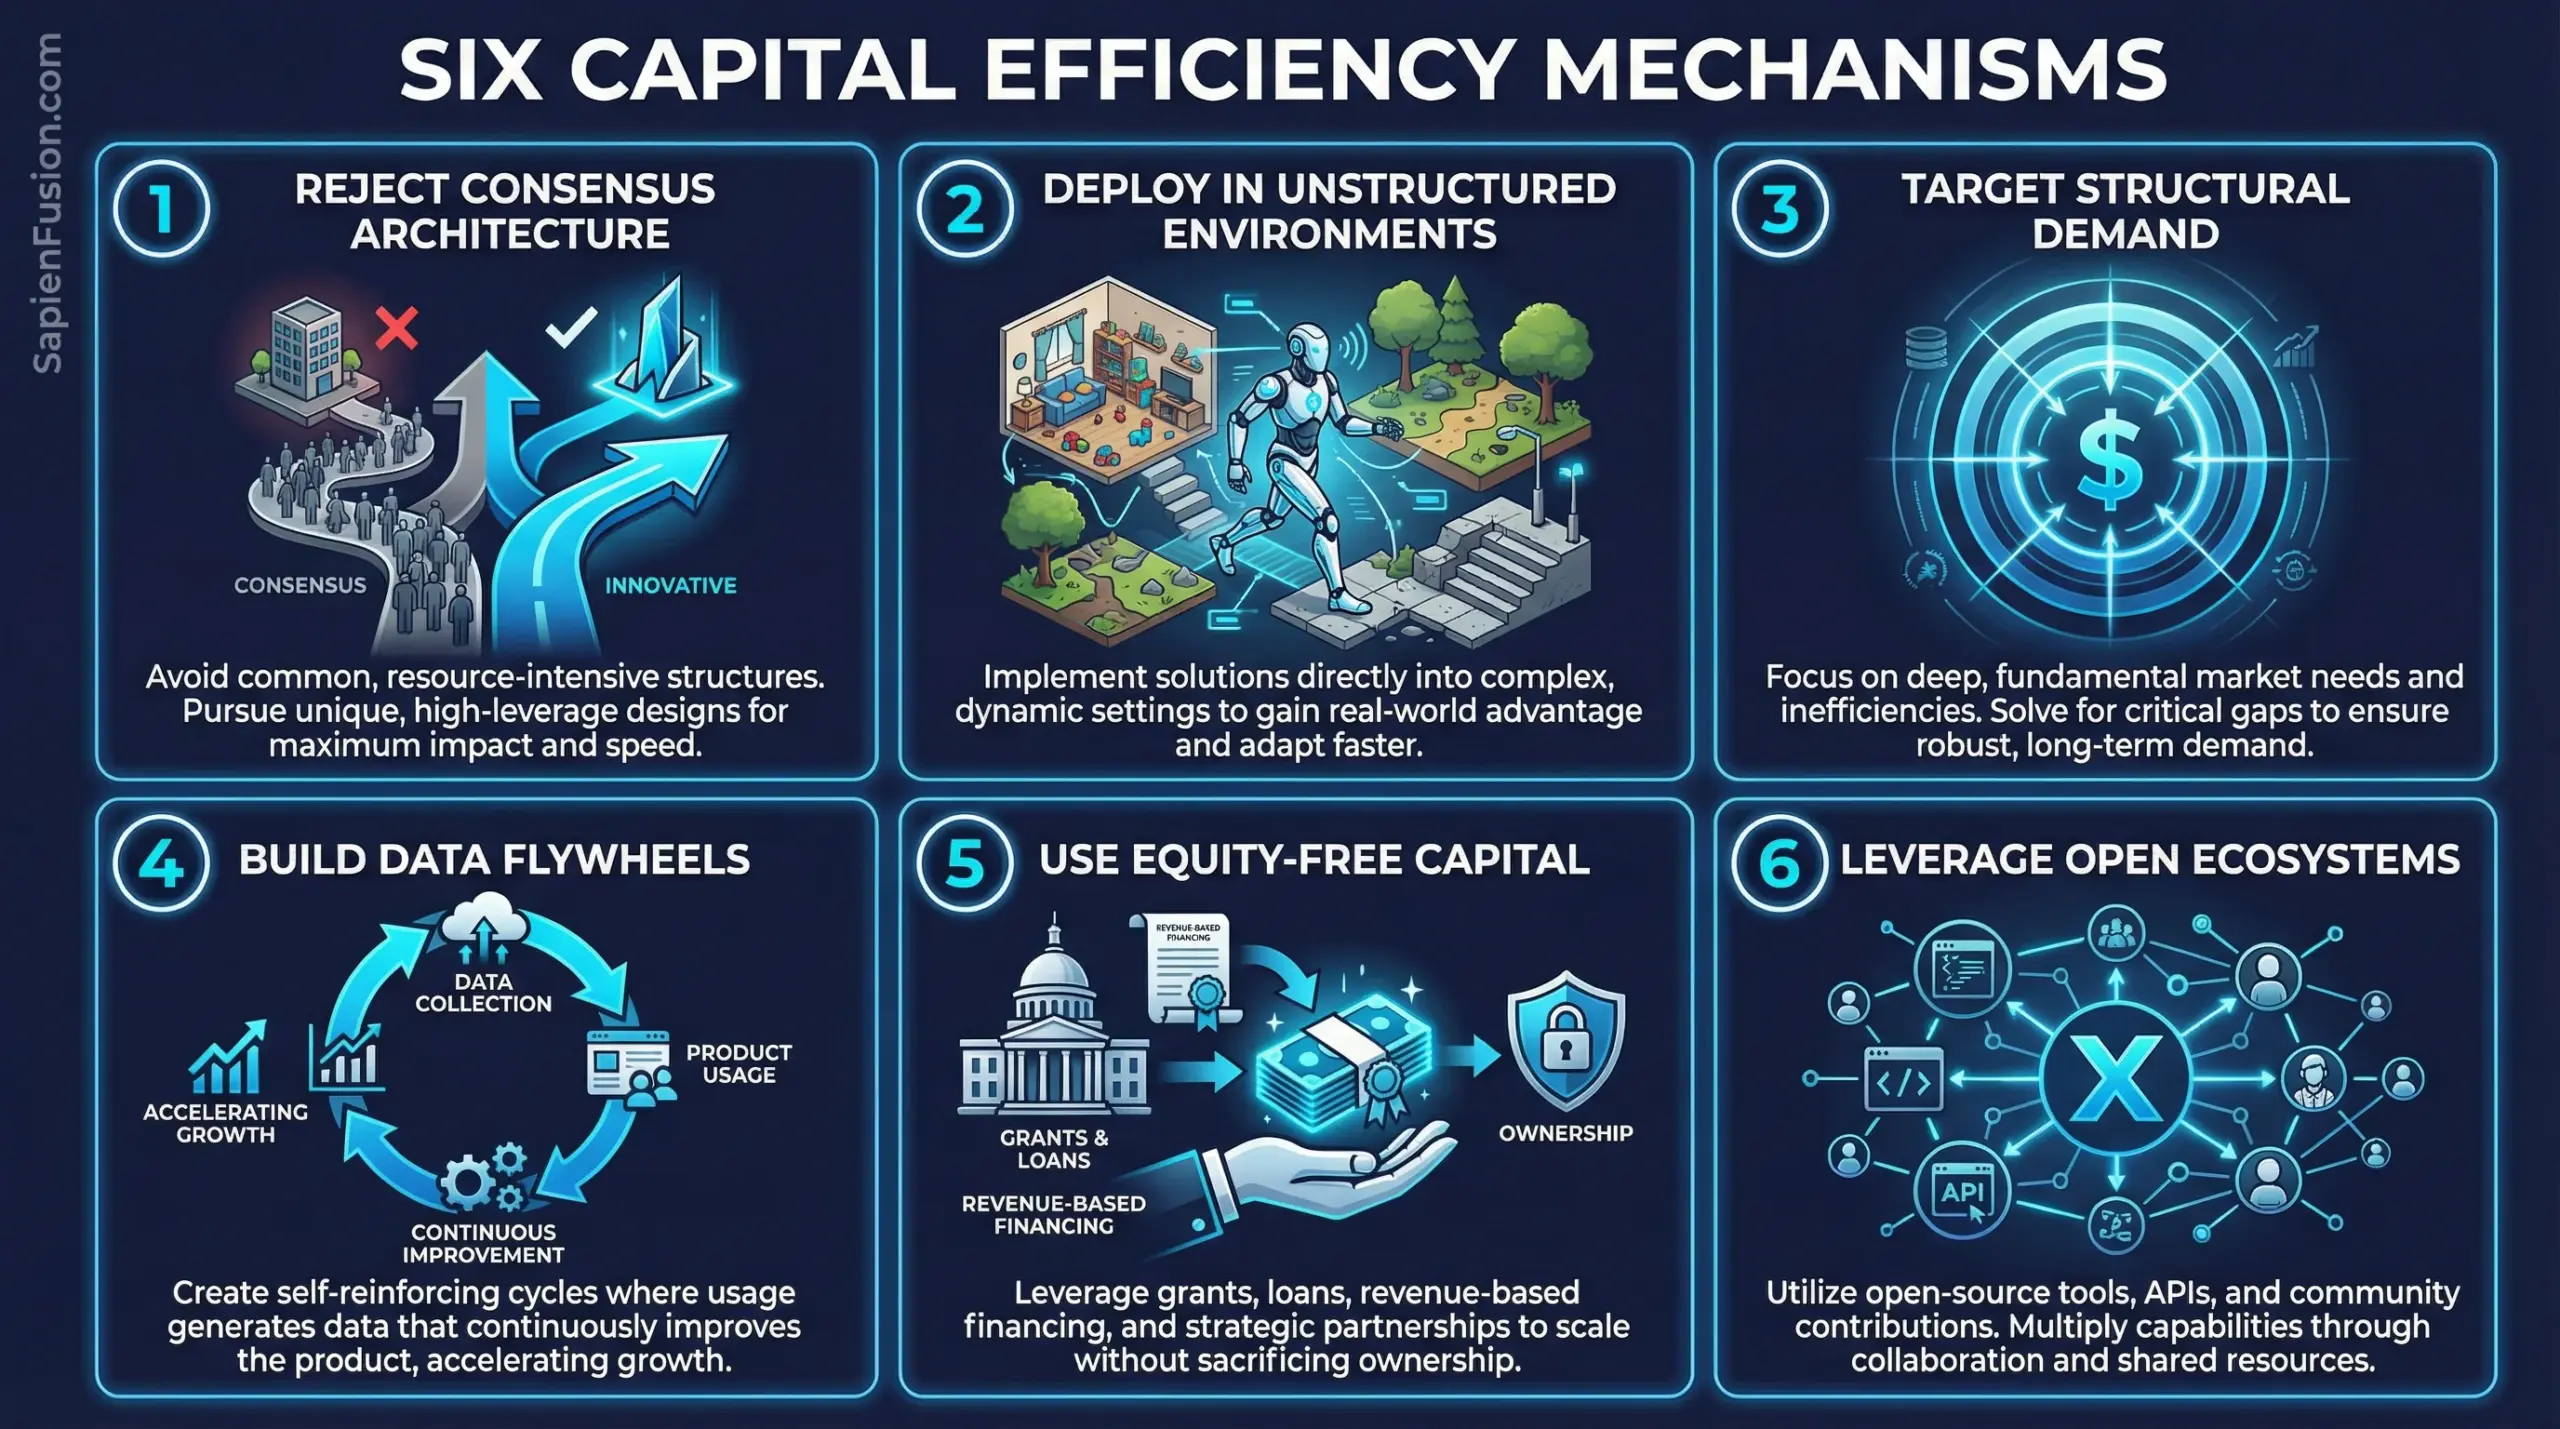
The Six Capital Efficiency Mechanisms
Cross-Cutting Analysis from Six Frontier Technology Leaders
When Alona Kharchenko was planning her sister’s escape from Ukraine while simultaneously finishing a robot sold to Oxford University, she couldn’t afford approaches that wouldn’t work. When Andrea Thomaz spent 150 hours shadowing nurses before writing a single line of commercial code, she was validating demand before burning capital on assumptions.
Across six profiles examining women building at the convergence of Physical AI, biotech, and quantum computing, a consistent pattern emerges: capital efficiency isn’t about doing less with less—it’s about achieving breakthrough outcomes through architecture that compounds rather than burns resources.
This isn’t theory. These are verified mechanisms extracted from founders and executives who built:
- €720K to robots living in elderly homes (Devanthro)
- $725K in NSF grants to 1 million hospital deliveries (Diligent Robotics)
- 80% reduction in drug discovery lab costs through ML (insitro)
- 48-hour vaccine manufacturing timelines (Moderna via dual infrastructure)
- Foundation models trained on internet-scale video vs. curated datasets (World Labs)
- Open-source frameworks eliminating industry-wide research duplication (Meta AI/Mila)
This final installment synthesizes actionable frameworks, decision points, and strategic implications for operators, investors, and policymakers working in capital-intensive frontier technology domains.
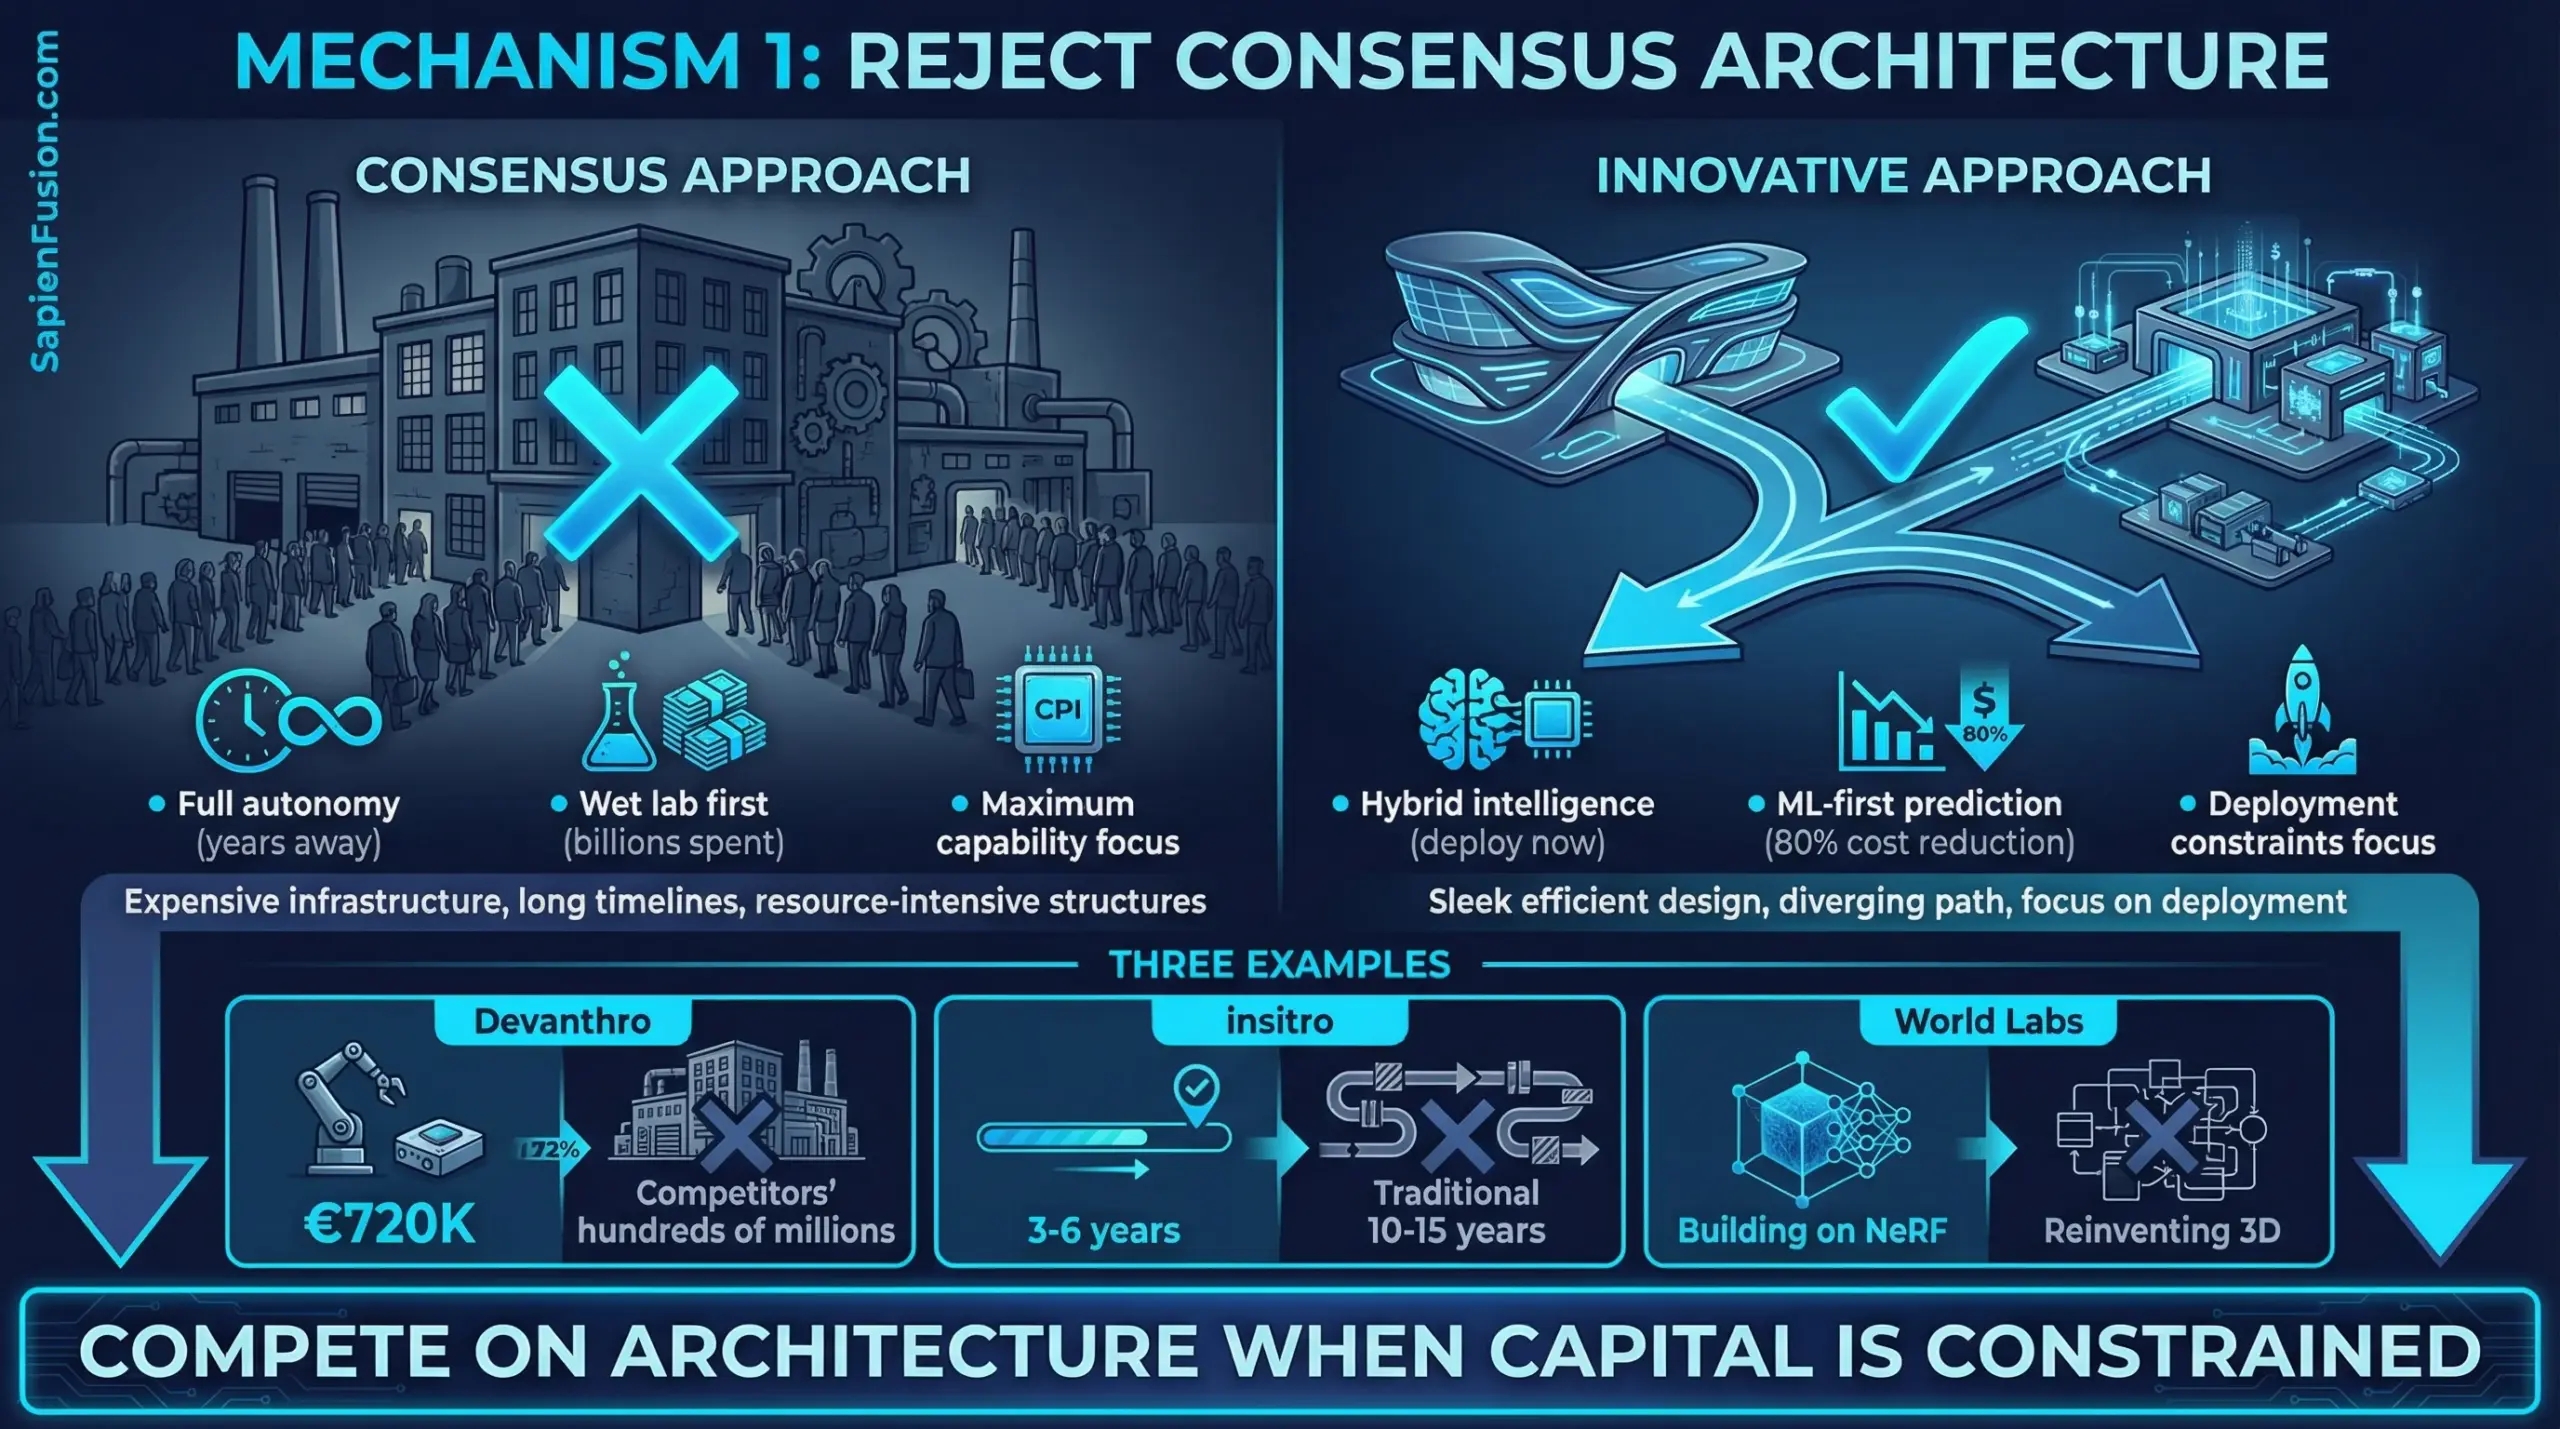
1. Reject Consensus Architecture When Constraints Favor Different Approaches
The Pattern: When everyone has access to similar capital, you compete on deployment speed. When capital is constrained, you compete on architecture—and better architecture often wins.
Case Studies:
Devanthro (Hybrid Intelligence vs. Full Autonomy): Most humanoid robotics companies chase full autonomy because that’s the Silicon Valley playbook—raise hundreds of millions, hire the best researchers, solve the hardest technical problems. Kharchenko recognized that “full autonomy in unstructured home environments is years away—for everyone.”
Instead: Human teleoperation via VR for complex tasks requiring empathy and judgment, with AI handling routine, repetitive actions. Every teleoperation session generates training data. More deployments → better autonomy → more deployments. Compounding advantage without betting on unsolved scientific problems.
Result: €720K to real-world deployment while competitors burn hundreds of millions in labs.
Diligent Robotics (Social Intelligence vs. Autonomous Completeness): Moxi doesn’t try to autonomously solve every hospital delivery edge case. It’s designed around social intelligence—opening elevator doors, avoiding collisions, asking humans for help when uncertain, learning from demonstration.
The technical bet: Robots working alongside people in unstructured environments need social intelligence more than full autonomy. Human-guided learning generates training data while accomplishing useful work.
Result: $725K in NSF grants to commercial deployment, 1 million deliveries by March 2025, while consumer robotics companies with $73M+ funding (Jibo) shut down.
insitro (Computational Prediction vs. Wet Lab Experiments): Traditional drug discovery burns billions testing hypotheses in wet labs. Most experiments fail. The capital intensity is structural—you can’t know which compounds will work without expensive testing.
Koller’s architecture: Machine learning models predict which experiments are worth running, reducing wet lab work by 80%. Each experiment improves model accuracy, creating a data flywheel that strengthens competitive moat over time.
Result: Addressing biotech’s fundamental capital intensity problem through architecture rather than fundraising.
Actionable Framework:
When to reject consensus architecture:
- Capital constraint is severe – You cannot match well-funded competitors on their terms
- Technical maturity favors alternatives – The “obvious” approach requires unsolved breakthroughs
- Customer willingness exists – Users will pay for imperfect solutions to urgent problems
- Data flywheel potential – Your approach generates compounding advantages through use
Decision checklist:
- Can we achieve 80%+ of value with 20% of consensus approach complexity?
- Does our architecture generate data/learning that compounds over time?
- Will customers pay for this imperfect solution while we iterate?
- Does constraint force clarity that well-funded competitors lack?
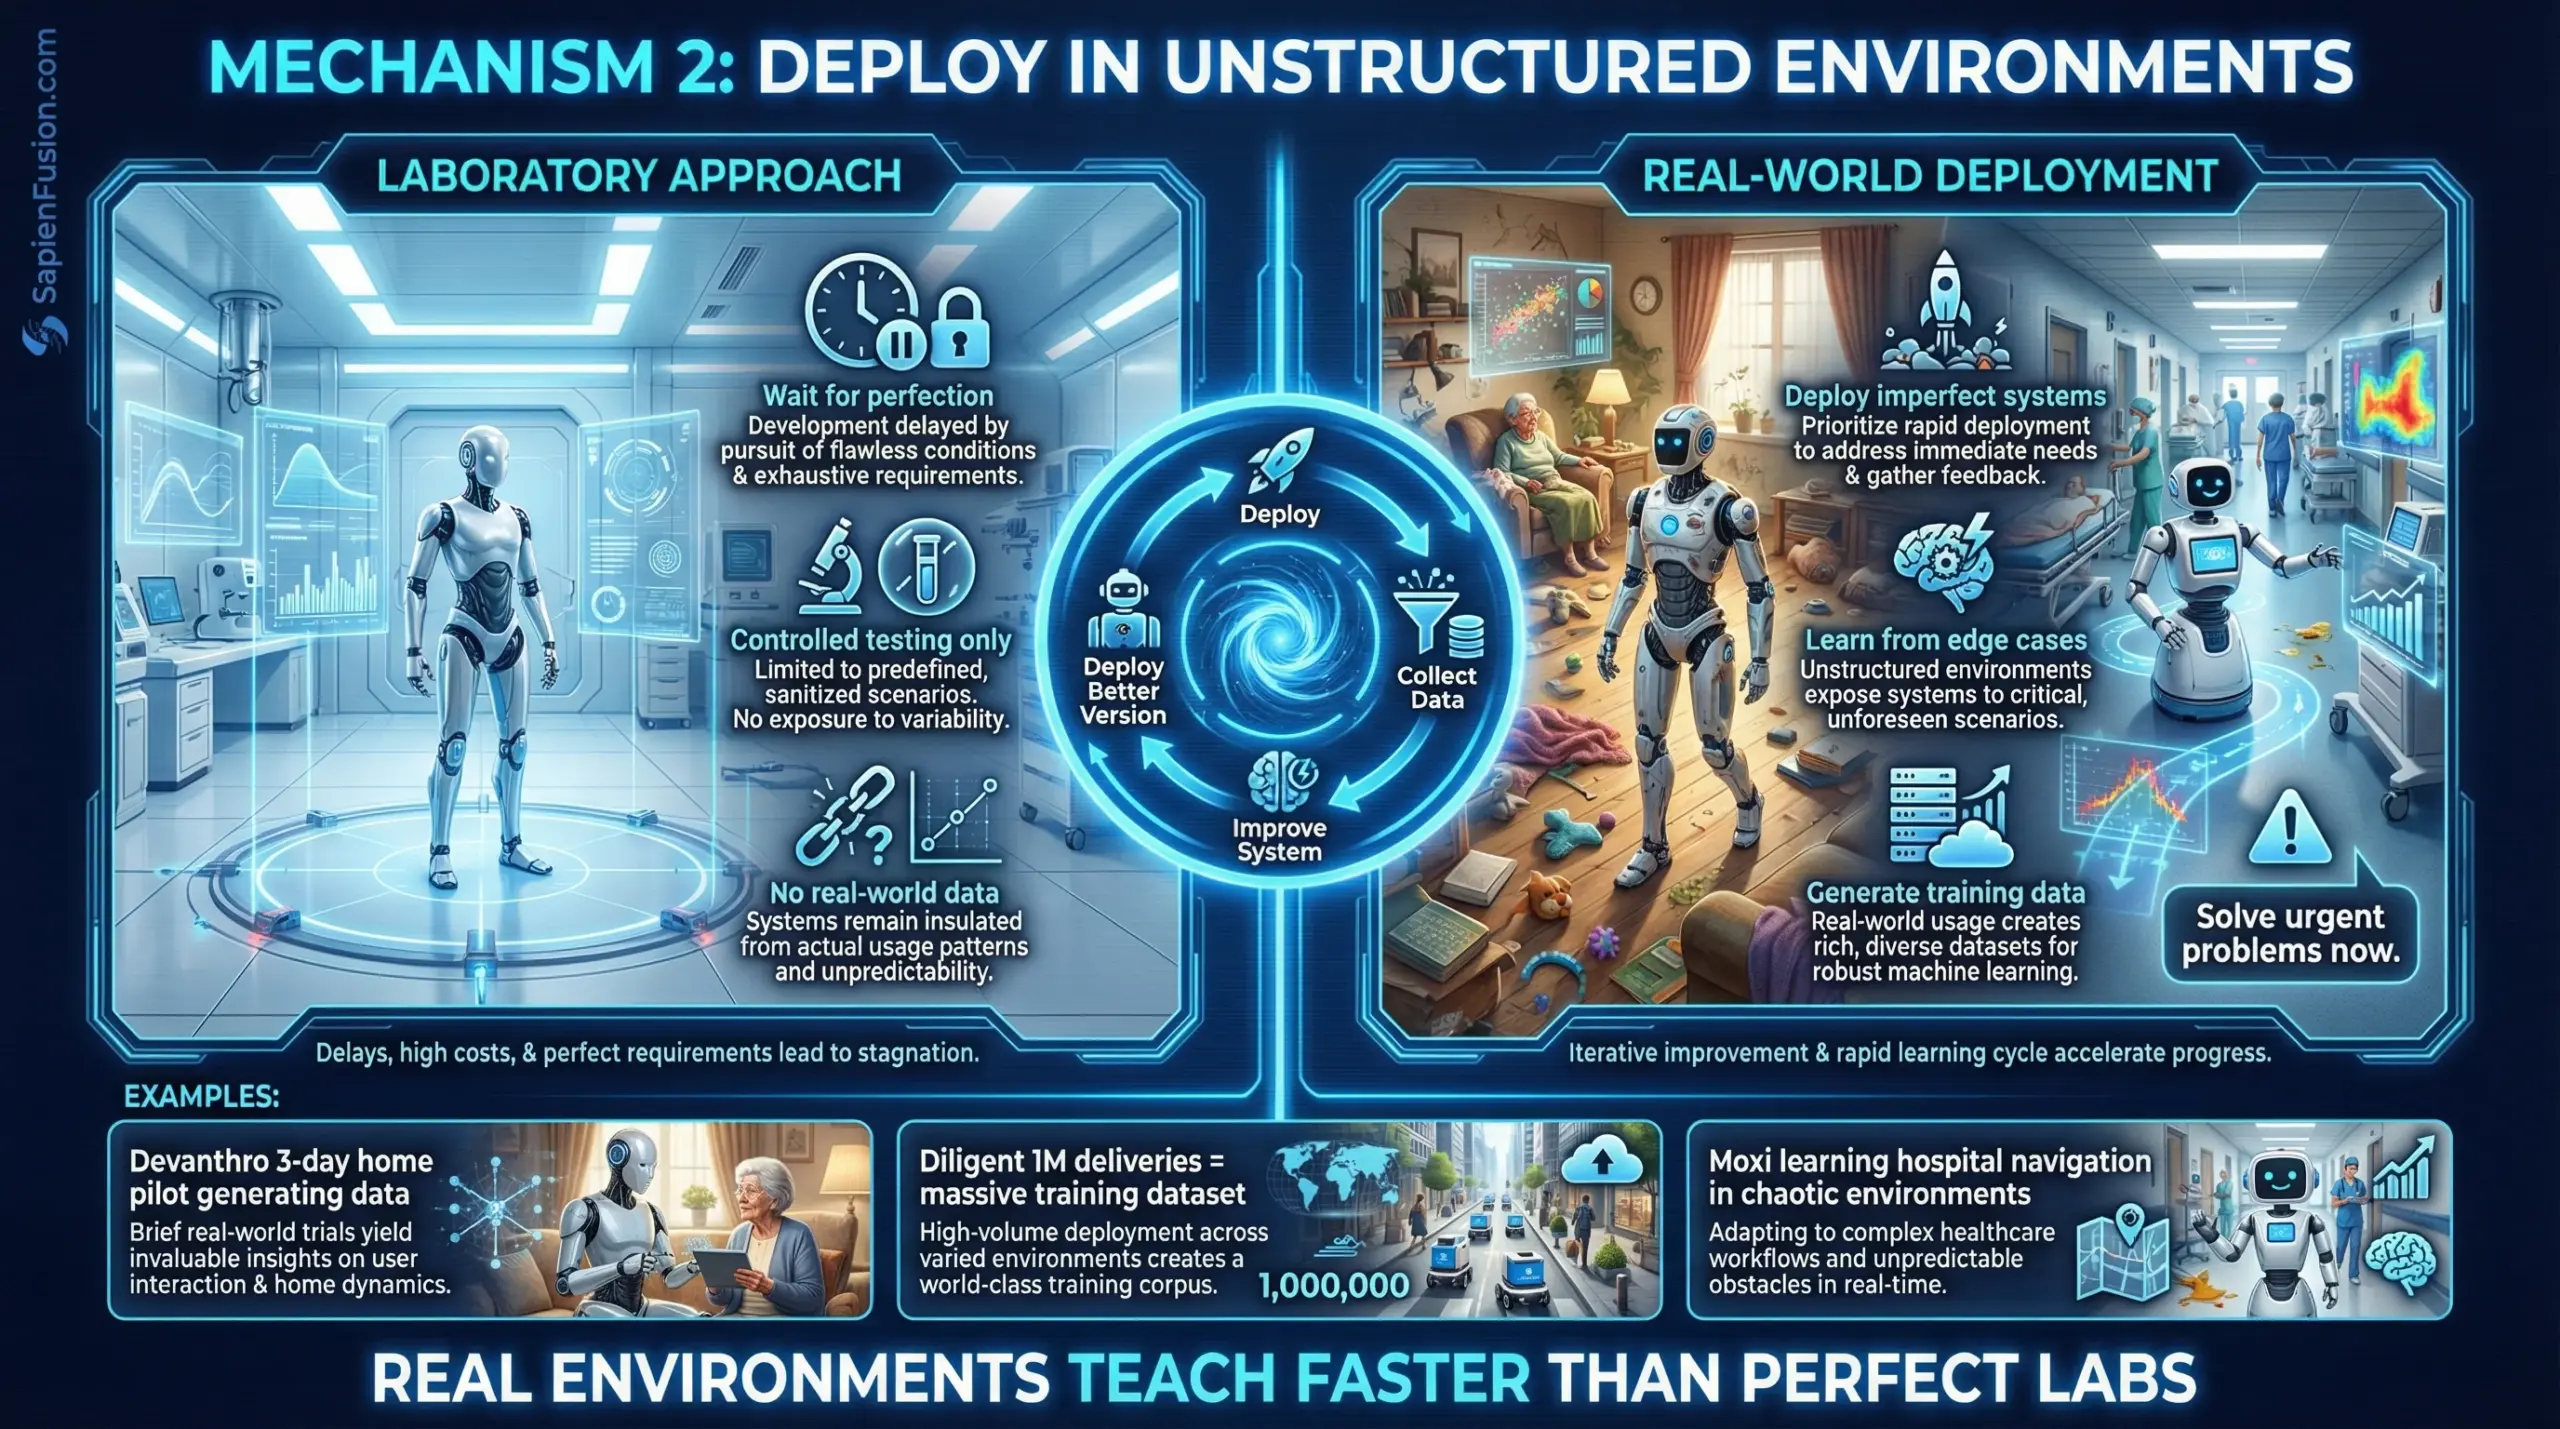
2. Deploy Early in Unstructured Environments
The Pattern: Laboratory perfection is capital-intensive. Real-world deployment with imperfect systems generates data that matters while proving commercial viability.
Case Studies:
Devanthro (Homes vs. Labs): While competitors pursued laboratory perfection, Kharchenko deployed Robody in real homes with “rugs layered on rugs, narrow corridors, and unpredictable human behavior.” The March 2024 three-day pilot with an 89-year-old resident wasn’t a controlled experiment—it was messy reality.
The learning: Hanging laundry collaboratively with an elderly person reveals edge cases no lab environment captures. Textile unpredictability, material deformation, real-time adaptive responses to human preferences—these emerge only through deployment.
Diligent Robotics (Hospital Pilots 2018-2019): Thomaz spent six months with NSF SBIR Phase II funding working with three different hospitals in Austin. Not building in isolation, then launching—building with hospitals, incorporating direct feedback from care teams to shape how Moxi fits into clinical workflows.
By 2020 commercial launch, the core technology had been validated in real environments with actual users. Deployment didn’t require convincing hospitals to try unproven technology—it required scaling what already worked.
Orlance/Sanofi (Dual Infrastructure Clinical Trials): Heffernan-Marks designed clinical trial frameworks that could operate through either traditional infrastructure or decentralized approaches. This wasn’t theoretical—when pandemic hit, the dual architecture enabled Moderna to manufacture vaccines within 48 hours of genetic sequence receipt.
The constraint (uncertainty about which infrastructure would be available) forced redundancy that became strategic advantage.
Actionable Framework:
How to deploy imperfect systems profitably:
Phase 1: Controlled Partner Deployments (3-6 months)
- Select 2-4 early customers willing to collaborate on iteration
- Choose environments representative of broader market but with sophisticated users
- Instrument everything—capture data on failures, edge cases, user feedback
- Commit to rapid iteration cycles (weekly/biweekly updates)
Phase 2: Structured Learning (6-12 months)
- Document systematic patterns in failures and successes
- Identify which imperfections customers tolerate vs. blockers
- Build automated testing around discovered edge cases
- Create operational playbooks for deployment and support
Phase 3: Scaled Deployment (12+ months)
- Leverage learnings to reduce deployment timeline (Diligent: 12 weeks per hospital)
- Use early customer case studies to accelerate sales cycles
- Maintain feedback loops—each deployment still generates improvement data
Critical success factors:
- Early customers must be sophisticated users comfortable with imperfection
- You must have rapid iteration capability—slow update cycles waste learning
- Deployments must generate revenue or clear path to revenue
- Edge cases must inform product roadmap, not just get band-aided
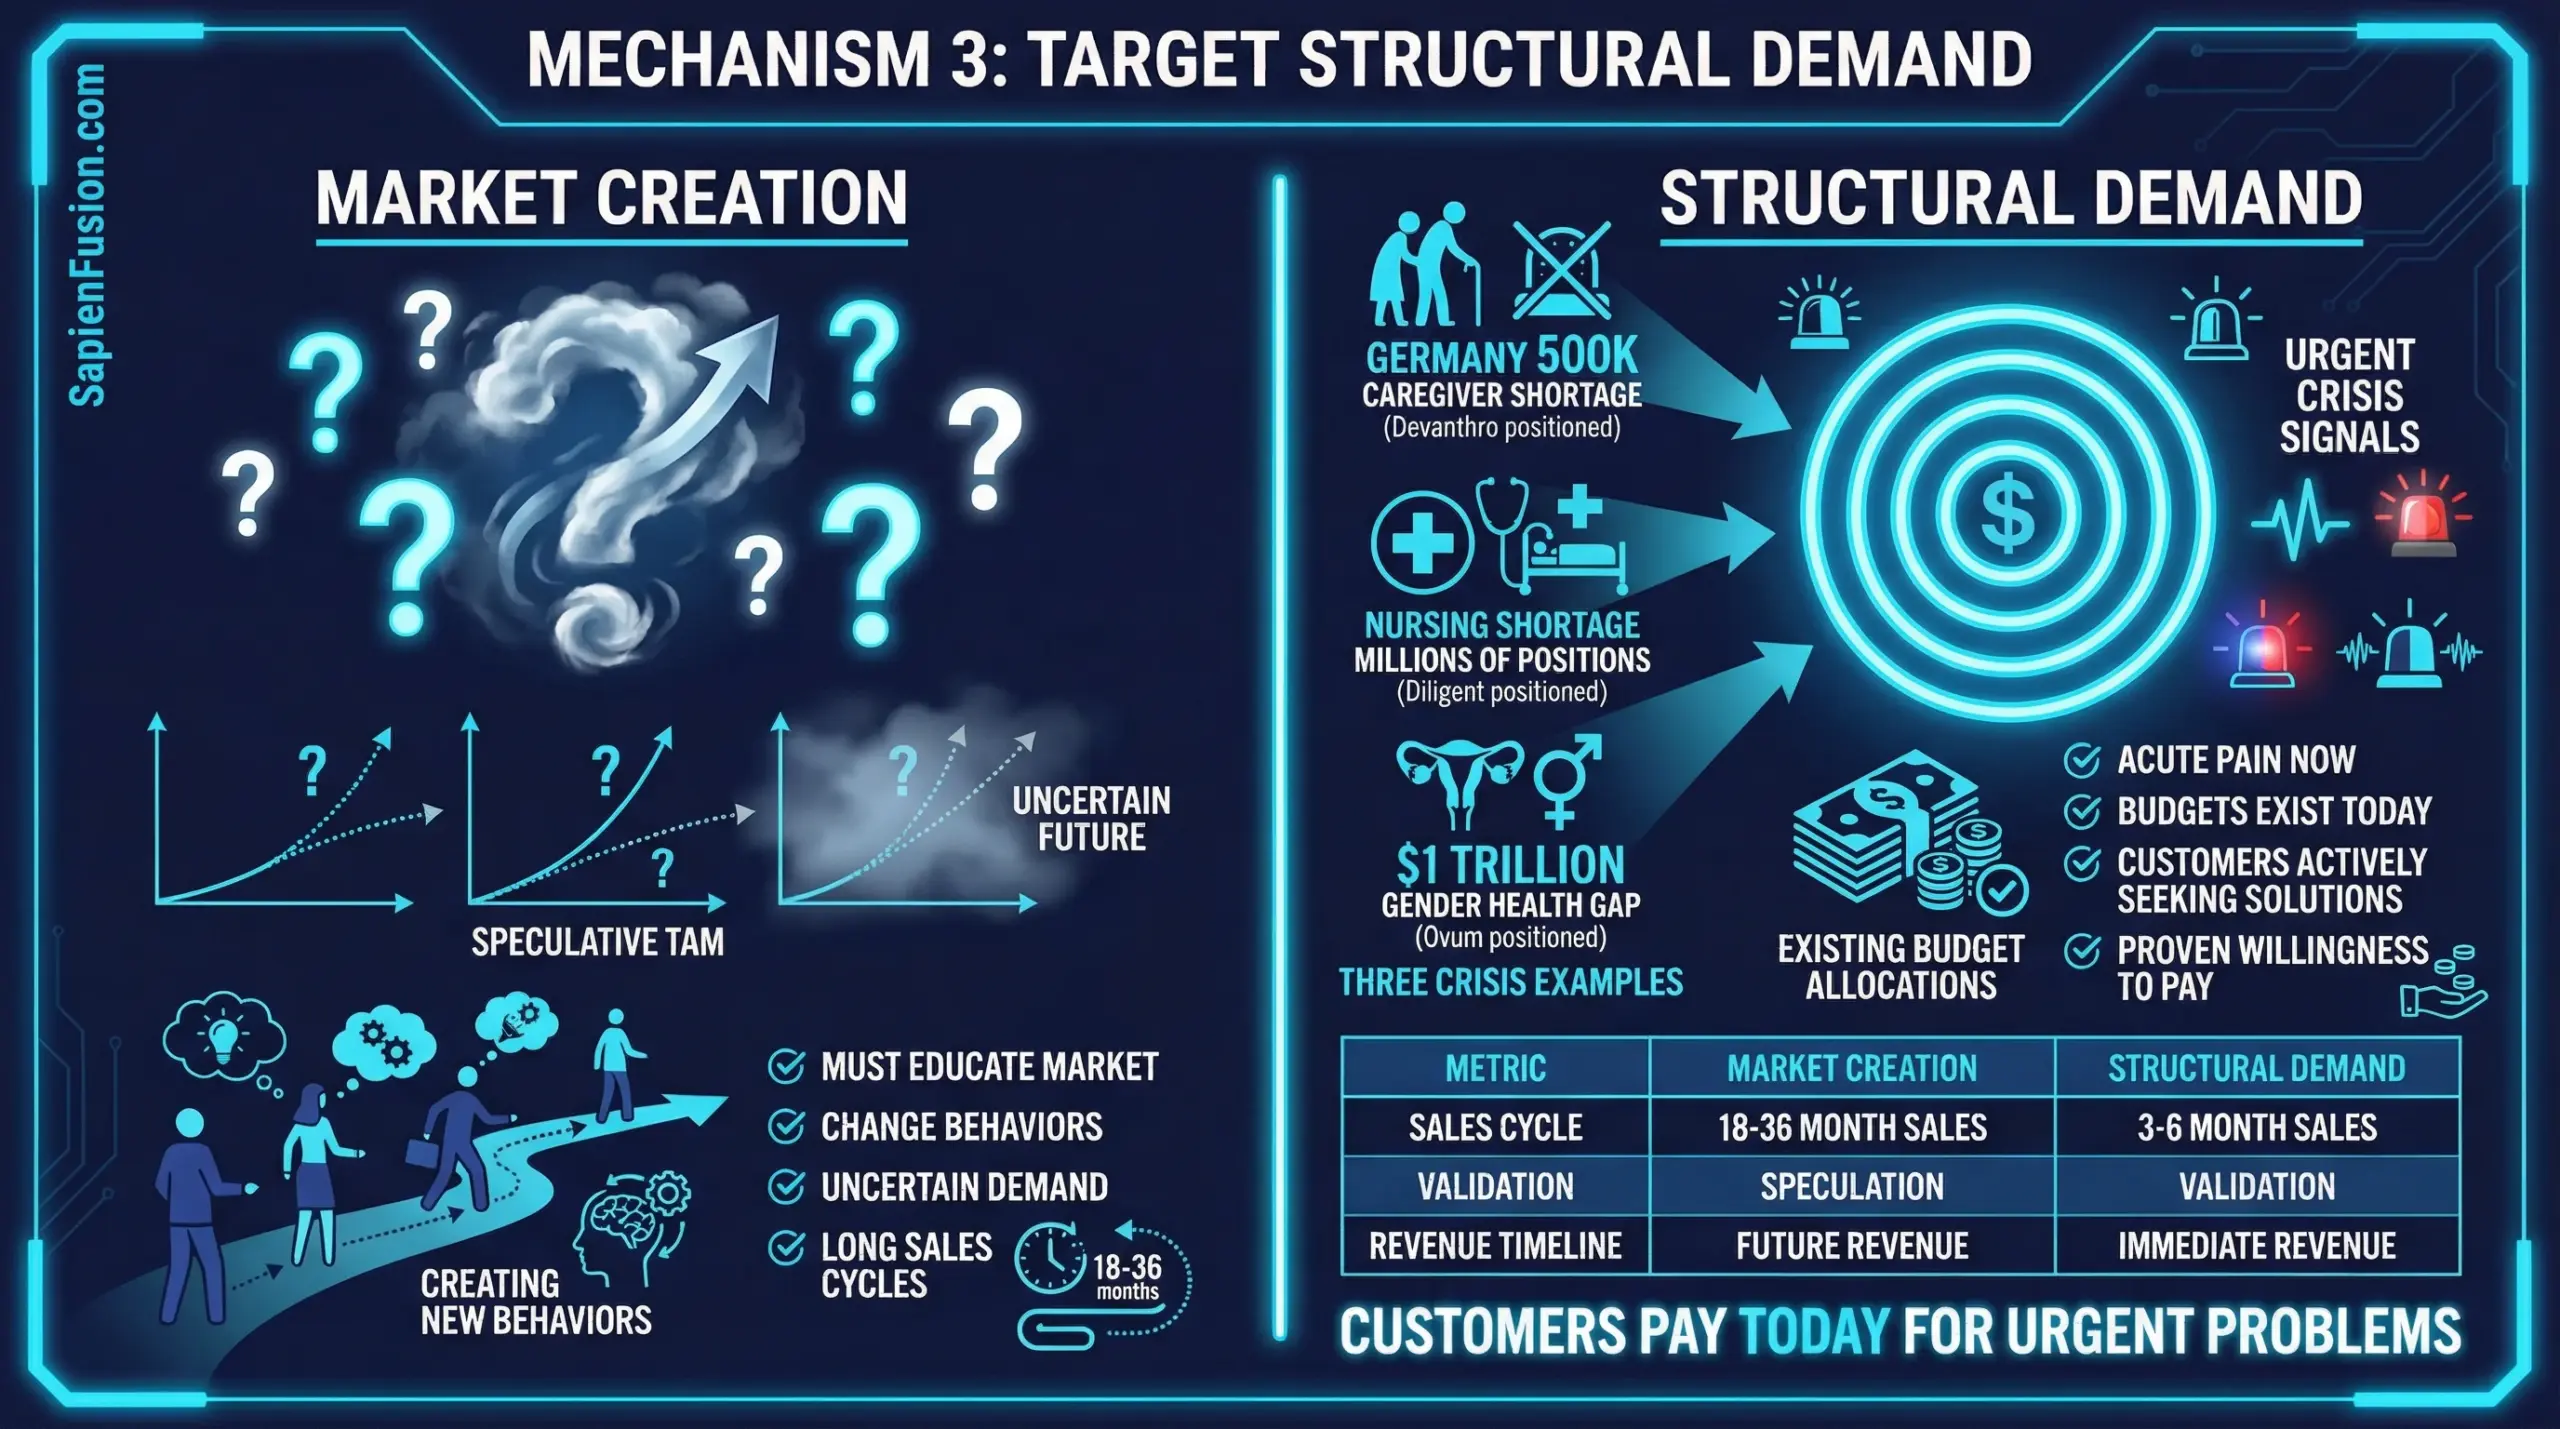
3. Target Structural Demand Where Customers Pay Today
The Pattern: When demand is structural, acute, and growing, you don’t need to create aspirational markets or educate customers. You execute on proven, urgent demand with technology that works now.
Case Studies:
Devanthro (150,000 Caregiver Shortage): Germany lacks 150,000 caregivers. Care services reject 60% of requested work because staff are burning out working 18-hour shifts. This isn’t speculative demand—it’s acute operational crisis affecting every care organization.
Kharchenko doesn’t need to convince anyone elderly care is important or that automation could help. She needs to demonstrate Robody works safely and effectively in real homes at price points competitive with existing care service models (€2,999/month vs. live-in caregivers).
Diligent Robotics (Nursing Shortage Crisis): “We’re getting cold outreach on our website from CIOs of hospitals saying ‘I need to develop a robotic strategy for our hospital,'” Thomaz noted post-pandemic. Chief Nursing Officers aren’t evaluating whether automation might be useful—they’re asking which automation solution works now.
The global smart hospital market ($27.6B in 2021 → $82.89B by 2026) isn’t growth from adoption—it’s growth from desperation. Hospitals cannot expand capacity without addressing workforce constraints.
Sanofi Ventures (Drug Development Cost Crisis): Clinical trials represent 40% of the $2.6 billion average drug development cost. Pharmaceutical companies aren’t evaluating whether trial optimization might help—they’re measuring which approaches demonstrably reduce that massive cost center.
Heffernan-Marks’ portfolio companies (Orlance at $280M valuation in 2023 down market) succeed because they address existential cost problems, not aspirational efficiency gains.
Actionable Framework:
Identifying structural vs. aspirational demand:
Structural Demand Characteristics:
- Customers actively searching for solutions (inbound interest without marketing)
- Budget already allocated (reallocation vs. new budget approval)
- Operational pain measurable in dollars/hours (not “nice to have” efficiency)
- Problem getting worse over time (shortage, cost increase, regulatory pressure)
- Multiple customers facing identical problem independently
Aspirational Demand Characteristics:
- Requires education on why problem matters
- Budget needs approval through new initiatives
- Benefits described in abstract terms (innovation, future-proofing)
- Problem stable or slowly evolving
- Each customer thinks their situation is unique
Decision framework:
| Question | Structural | Aspirational |
|---|---|---|
| Will customers pay today? | Yes, actively seeking | Maybe, need convincing |
| Budget exists? | Reallocating existing | Requesting new |
| Pain quantifiable? | $X loss/month | “Inefficiency” |
| Competitive intensity? | Customers call you | You cold call |
| Sales cycle? | 3-6 months | 12-24 months |
Target structural demand when:
- Your capital is limited (can’t afford long sales cycles)
- Your technology is imperfect (customers tolerate gaps for urgent problems)
- Market education is expensive (shifting behavior costs more than you can spend)
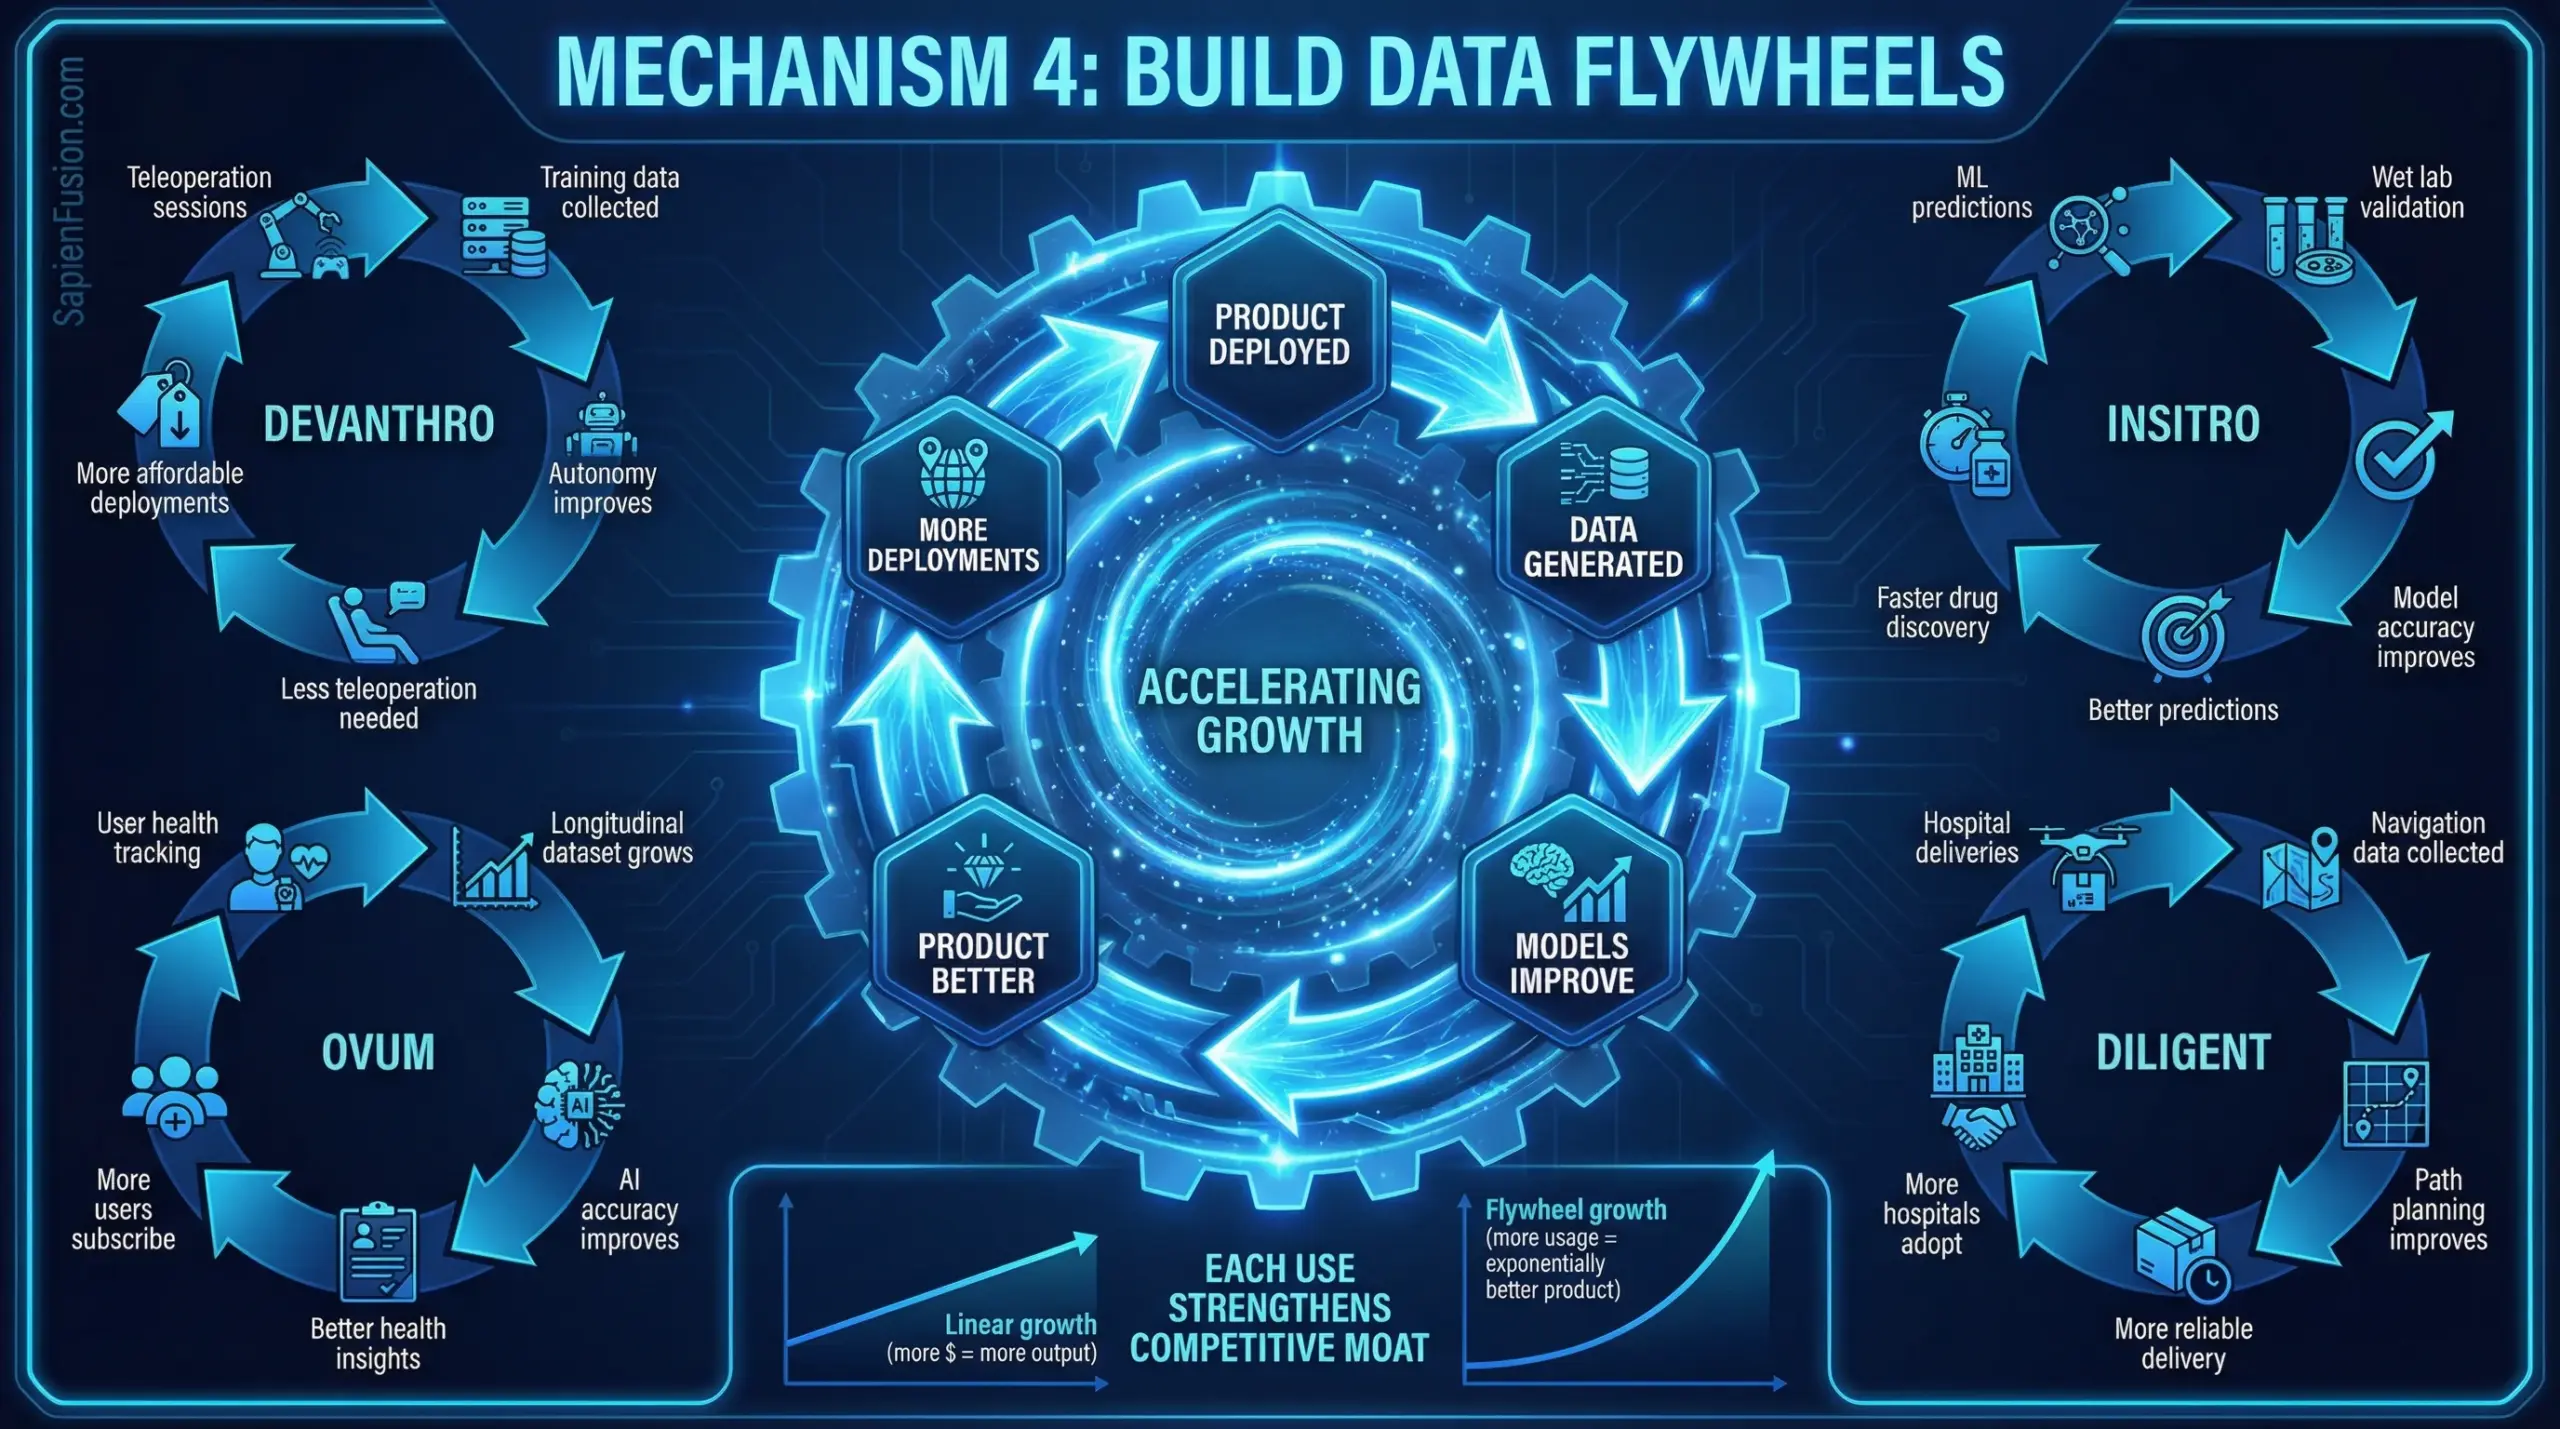
4. Build Data Flywheels That Compound
The Pattern: The most capital-efficient systems improve through use, creating moats that strengthen over time without proportional capital increases.
Case Studies:
Devanthro (Teleoperation → Training Data → Autonomy): Every teleoperation session generates labeled training data. Human operators demonstrate how to navigate specific environments, handle particular objects, respond to individual user preferences. This data trains autonomy systems.
As autonomy improves, operators handle only complex edge cases, generating higher-value training data on exactly the scenarios where AI struggles. More deployments → better autonomy → ability to take on more deployments.
The competitive moat: Later entrants don’t have millions of hours of in-home interaction data. They’re starting from zero while Devanthro’s models improve daily.
insitro (Experiments → ML Accuracy → Better Predictions): Traditional drug discovery: Run experiment → Analyze result → Design next experiment based on hypothesis.
insitro’s flywheel: Run experiment → Feed data to ML models → Models predict which experiments have highest information value → Run those experiments → Models get more accurate → Predictions get better → Fewer failed experiments.
Each experimental iteration improves both the specific drug program and the platform’s predictive accuracy across all programs. The 20th drug program benefits from learnings across the previous 19.
Diligent Robotics (Deliveries → VLM Improvement → Deployment): “With all of the data that we’ve been able to run through those models, we’ve gotten really good at being able to do semantic scene understanding in a busy human, indoor environment,” Thomaz explained after 1 million deliveries.
Visual language models learn: which objects are graspable, which hallways allow two-way traffic, which door handles require which grip patterns, which elevator button arrangements are standard vs. unusual. This learning transfers across hospitals—the 50th deployment is faster and more reliable than the first.
World Labs (Video Processing → 3D Understanding → Better Models): Training on internet-scale unstructured video creates compound advantage. As models improve at inferring 3D structure from 2D video, they can leverage lower-quality or more ambiguous video sources. This expands the training dataset, which improves the models, which expands viable data sources.
Competitors starting today face billions of hours of video that World Labs has already processed and learned from.
Actionable Framework:
Designing data flywheels:
Step 1: Identify the Learning Loop What gets better as you do more of the core activity?
- Prediction accuracy (ML models)
- Process efficiency (operational learning)
- Edge case coverage (rare scenario handling)
- Customer understanding (personalization)
Step 2: Instrument Data Capture
- Automated: System logs, sensor data, user interactions
- Manual: Operator corrections, customer feedback, failure analysis
- Passive: Usage patterns, performance metrics, environmental conditions
Step 3: Create Feedback Mechanisms
- Short loop (hours-days): Immediate model updates, A/B testing
- Medium loop (weeks-months): Feature improvements, workflow optimization
- Long loop (quarters-years): Platform evolution, new capabilities
Step 4: Ensure Data Transfers Across Customers
- Generalized models (not customer-specific)
- Shared edge case handling
- Cross-deployment pattern recognition
- Privacy-preserving aggregation
Step 5: Measure Flywheel Velocity
- Time to deployment (decreasing?)
- Performance metrics (improving?)
- Edge case frequency (declining?)
- Customer acquisition cost (falling as product improves?)
Red flags indicating weak flywheel:
- Deployment N requires same effort as deployment 1
- Each customer represents isolated learning
- Improvements benefit single customer only
- Data doesn’t inform platform development
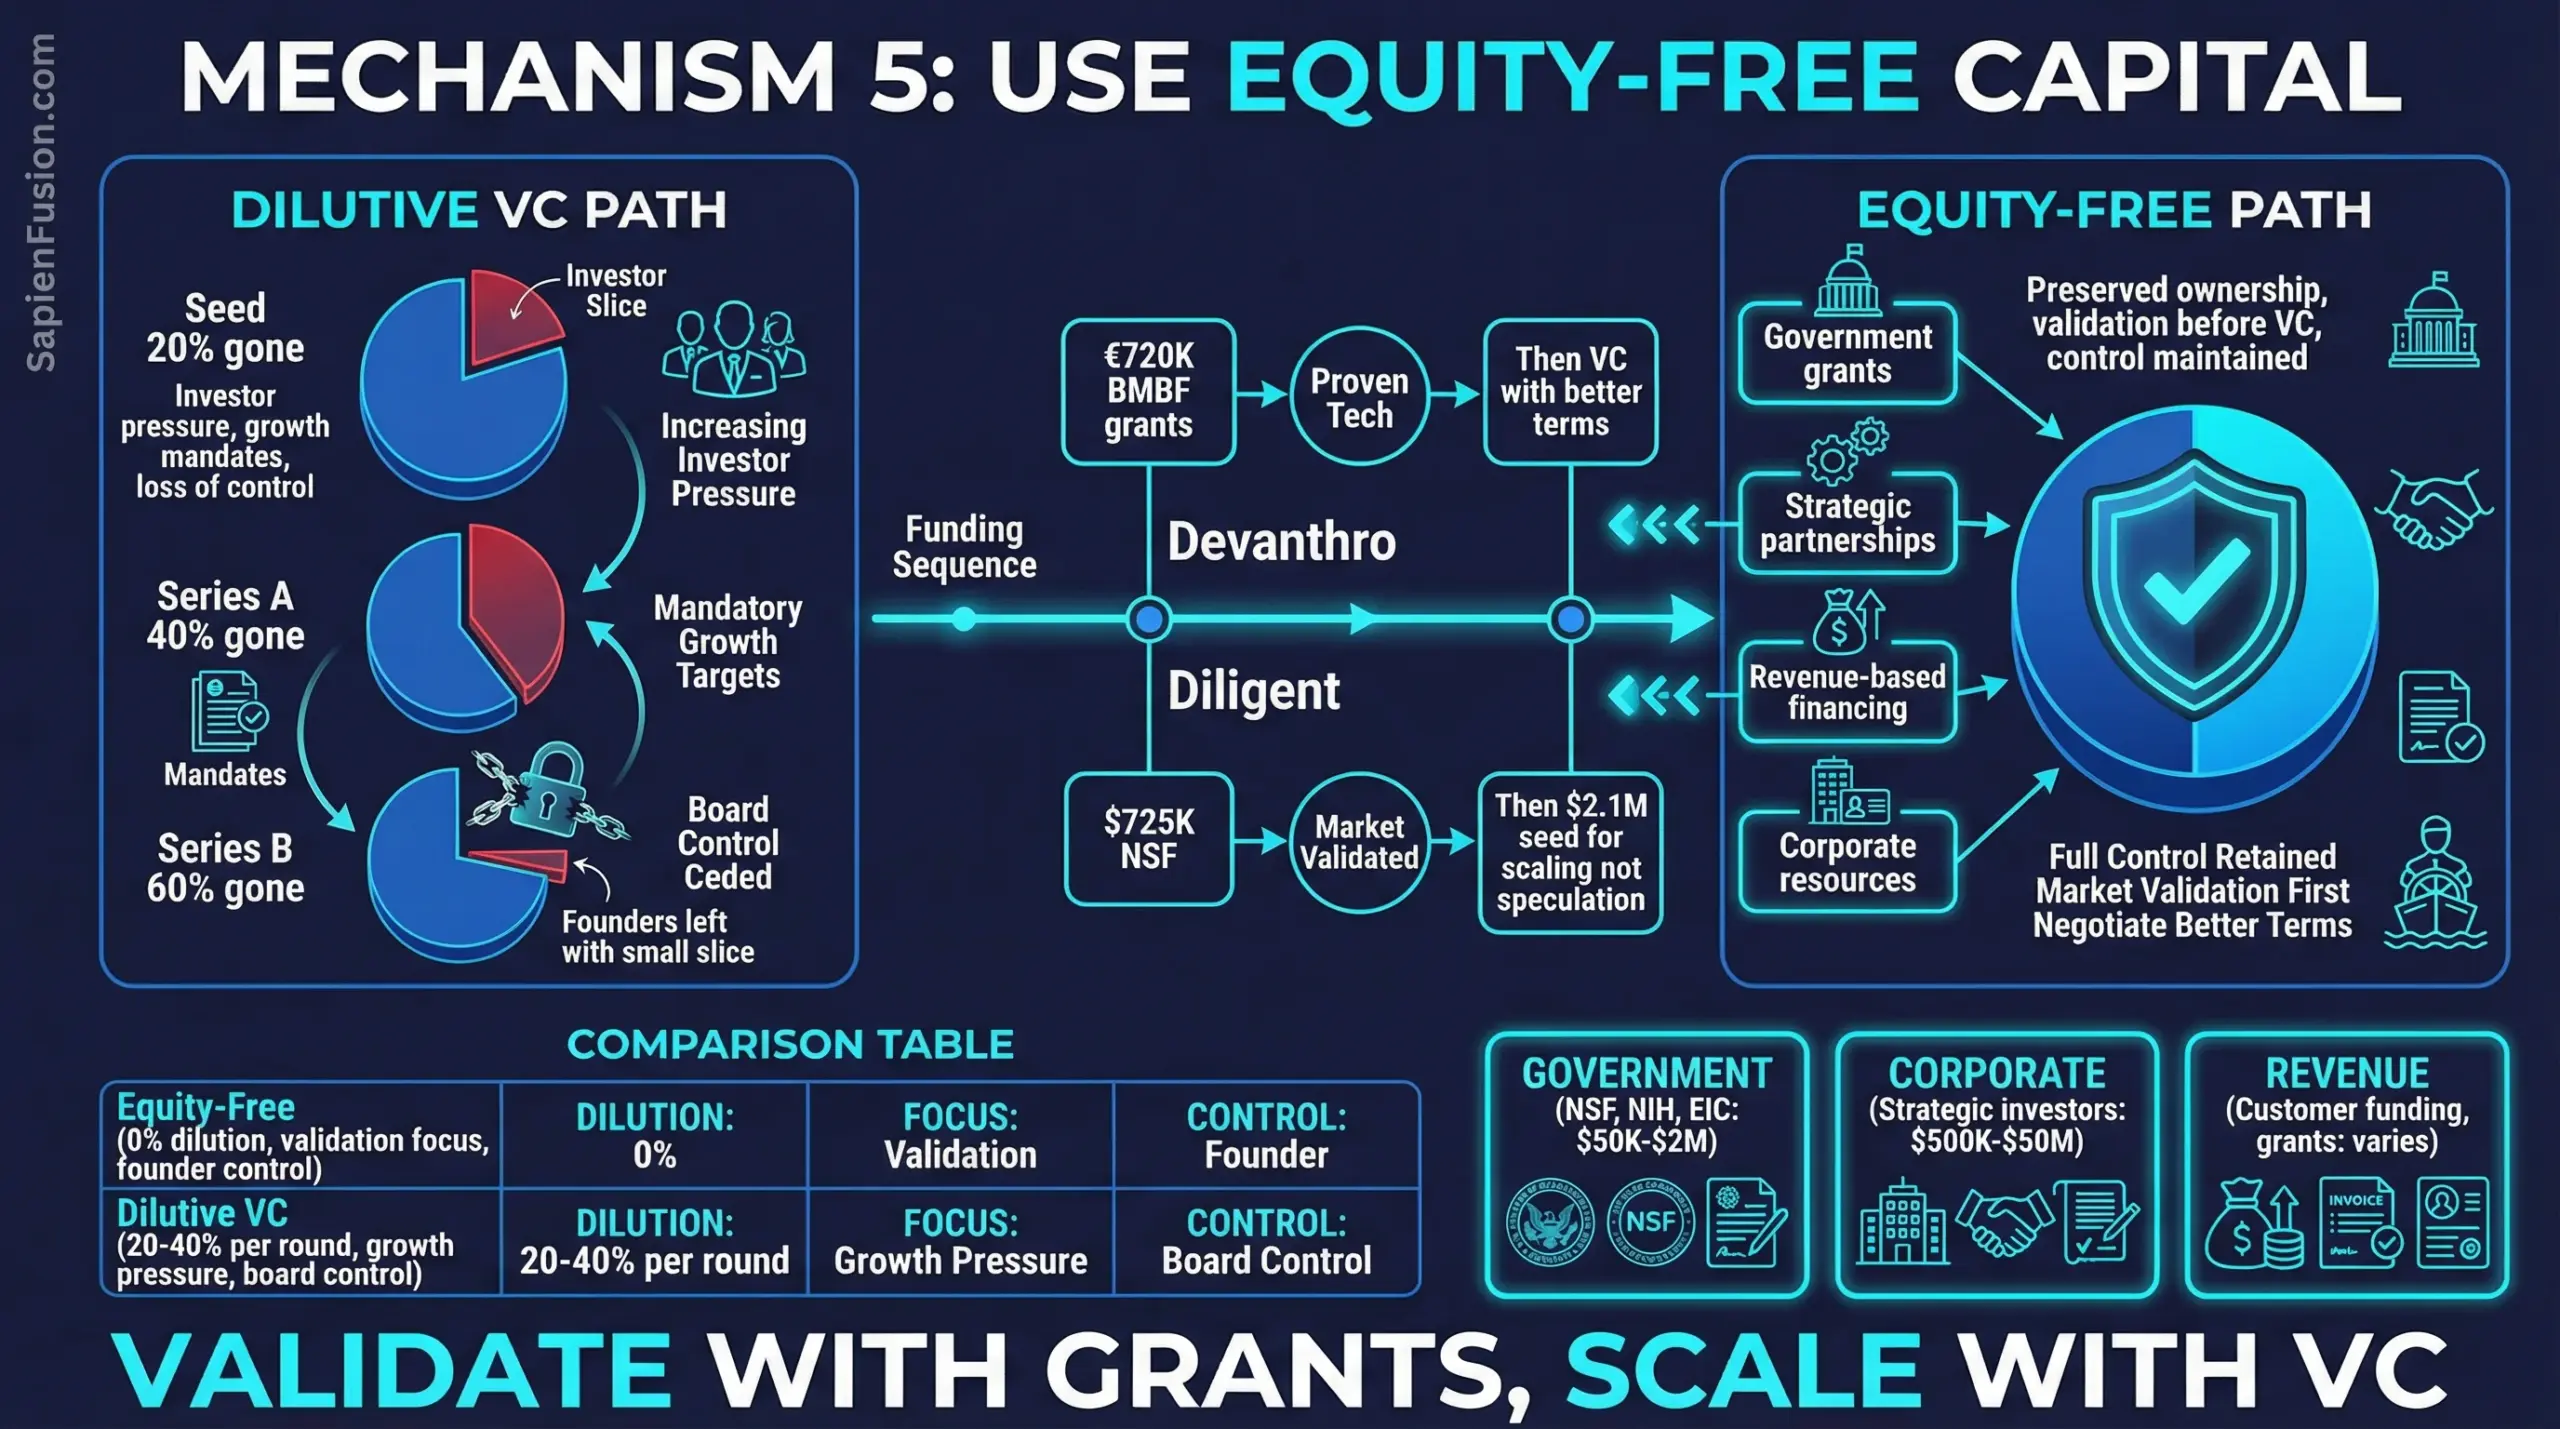
5. Use Equity-Free or Strategic Capital When Possible
The Pattern: Capital that doesn’t dilute equity or create investor pressure for premature scaling preserves optionality and maintains founder control during critical early phases.
Case Studies:
Devanthro (€720K Government Grants): Kharchenko secured BMBF grants totaling €720,000—equity-free funding that enabled:
- Building and testing Robody prototypes
- Completing multi-day home pilot with 89-year-old resident
- Developing hybrid intelligence architecture
- Establishing partnerships with care organizations
By the time Devanthro might seek venture capital, they have:
- Proven technology in real homes
- Unit economics validated (€18K production cost, €399 monthly profit, 9.6 month payback)
- Customer demand demonstrated
- Technical defensibility established
Investors aren’t funding a concept—they’re scaling proven operations. Valuation and terms reflect demonstrated traction, not speculative potential.
Diligent Robotics ($725K NSF Grants Before VC): Thomaz followed “the NSF commercialization path”:
- NSF I-Corps ($225K): Six-month market discovery, 150 hours shadowing nurses
- NSF SBIR Phase II ($500K): Six months working with three hospitals, building core technology, filing patents
This $725K funded the riskiest phases: validating that hospitals needed robot teammates, proving the technology could work in chaotic environments, establishing IP position.
The $2.1M seed round that followed funded scaling what NSF grants had validated. True Ventures wasn’t betting on whether hospitals needed automation—they were betting Thomaz could execute on proven demand.
Sanofi Ventures (Corporate Structure): Heffernan-Marks operates within Sanofi’s corporate venture structure, accessing:
- Pharmaceutical manufacturing infrastructure (no startup replication costs)
- Regulatory expertise (navigating FDA approval processes)
- Clinical trial networks (established relationships with research sites)
- Market access (distribution partnerships, payer relationships)
Portfolio companies leverage these assets without burning cash to build them. Orlance’s $32M Series A at $280M valuation (2023) reflected both the company’s innovation and Sanofi’s infrastructure leverage reducing capital intensity.
Meta AI/Mila (Institutional Resources): Pineau’s open science work operates within Meta AI Research and Mila—institutional contexts providing:
- Compute infrastructure (training large models)
- Talented researchers (top-tier hiring)
- Long-term funding stability (not dependent on quarterly milestones)
- Publishing freedom (academic credibility alongside industry impact)
Papers with Code could emerge because institutional resources eliminated startup constraints. The platform didn’t need to monetize immediately—it needed to solve reproducibility problems for the research community.
Actionable Framework:
Mapping non-dilutive capital sources:
Government Grants (NSF, NIH, DOE, DOD, EIC, etc.):
- Best for: Deep tech requiring extended R&D, academic founders with research credibility
- Timeline: 6-18 months application to award
- Amounts: $50K-$2M per grant
- Requirements: US affiliation (NSF/NIH), clear research deliverables, matching funds sometimes
- Strings attached: Publication requirements, IP may be restricted, reporting overhead
Corporate Venture/Strategic Investment:
- Best for: Startups in established industry value chains (pharma, automotive, industrial)
- Timeline: 3-6 months due diligence
- Amounts: $500K-$50M depending on stage
- Requirements: Strategic alignment with corporate objectives
- Strings attached: Board seats, rights of first refusal, potential acquirer conflicts
University/Research Institution Resources:
- Best for: Technical founders with academic appointments, dual academic/commercial models
- Timeline: Ongoing as part of position
- Amounts: Varies widely
- Requirements: Faculty/research position, publication expectations
- Strings attached: IP assignment policies, time allocation constraints, potential conflicts of interest
Philanthropic/Foundation Funding:
- Best for: Social impact focus, mission-aligned innovation
- Timeline: 6-12 months
- Amounts: $50K-$5M
- Requirements: Clear impact metrics, mission alignment
- Strings attached: Reporting requirements, restrictions on commercial activity
Decision matrix: When to use each source
| Factor | Government Grants | Corporate Venture | University/Institution | Philanthropic |
|---|---|---|---|---|
| Technical risk | High (R&D focus) | Medium | High (research) | Medium |
| Market risk | Medium (validation) | Low (strategic) | High | Medium (impact) |
| Timeline to revenue | 18-36 months | 12-24 months | Varies widely | 24-48 months |
| Equity preservation | Excellent | Good | Excellent | Excellent |
| Operational control | Good | Medium | Good | Good |
| Strategic value | Medium | High | Medium | Medium |
Sequencing strategy:
Phase 1 (Concept → Proof-of-Concept):
- Government grants + university resources
- Goal: Technical validation, initial IP
- Timeline: 12-24 months
- Dilution: 0%
Phase 2 (Proof-of-Concept → Pilot Customers):
- Government grants (Phase II) + angel/small VC
- Goal: Product-market fit validation
- Timeline: 12-18 months
- Dilution: 10-20%
Phase 3 (Pilots → Commercial Traction):
- Strategic investors + institutional VC
- Goal: Scale proven model
- Timeline: 18-36 months
- Dilution: 20-30%
By Series A, you have:
- Validated technology (government grants)
- Proven market demand (pilots)
- Established strategic relationships (corporate investors)
- Preserved 50-70% equity for founders/team
- Raised institutional VC on strong terms (proven traction)
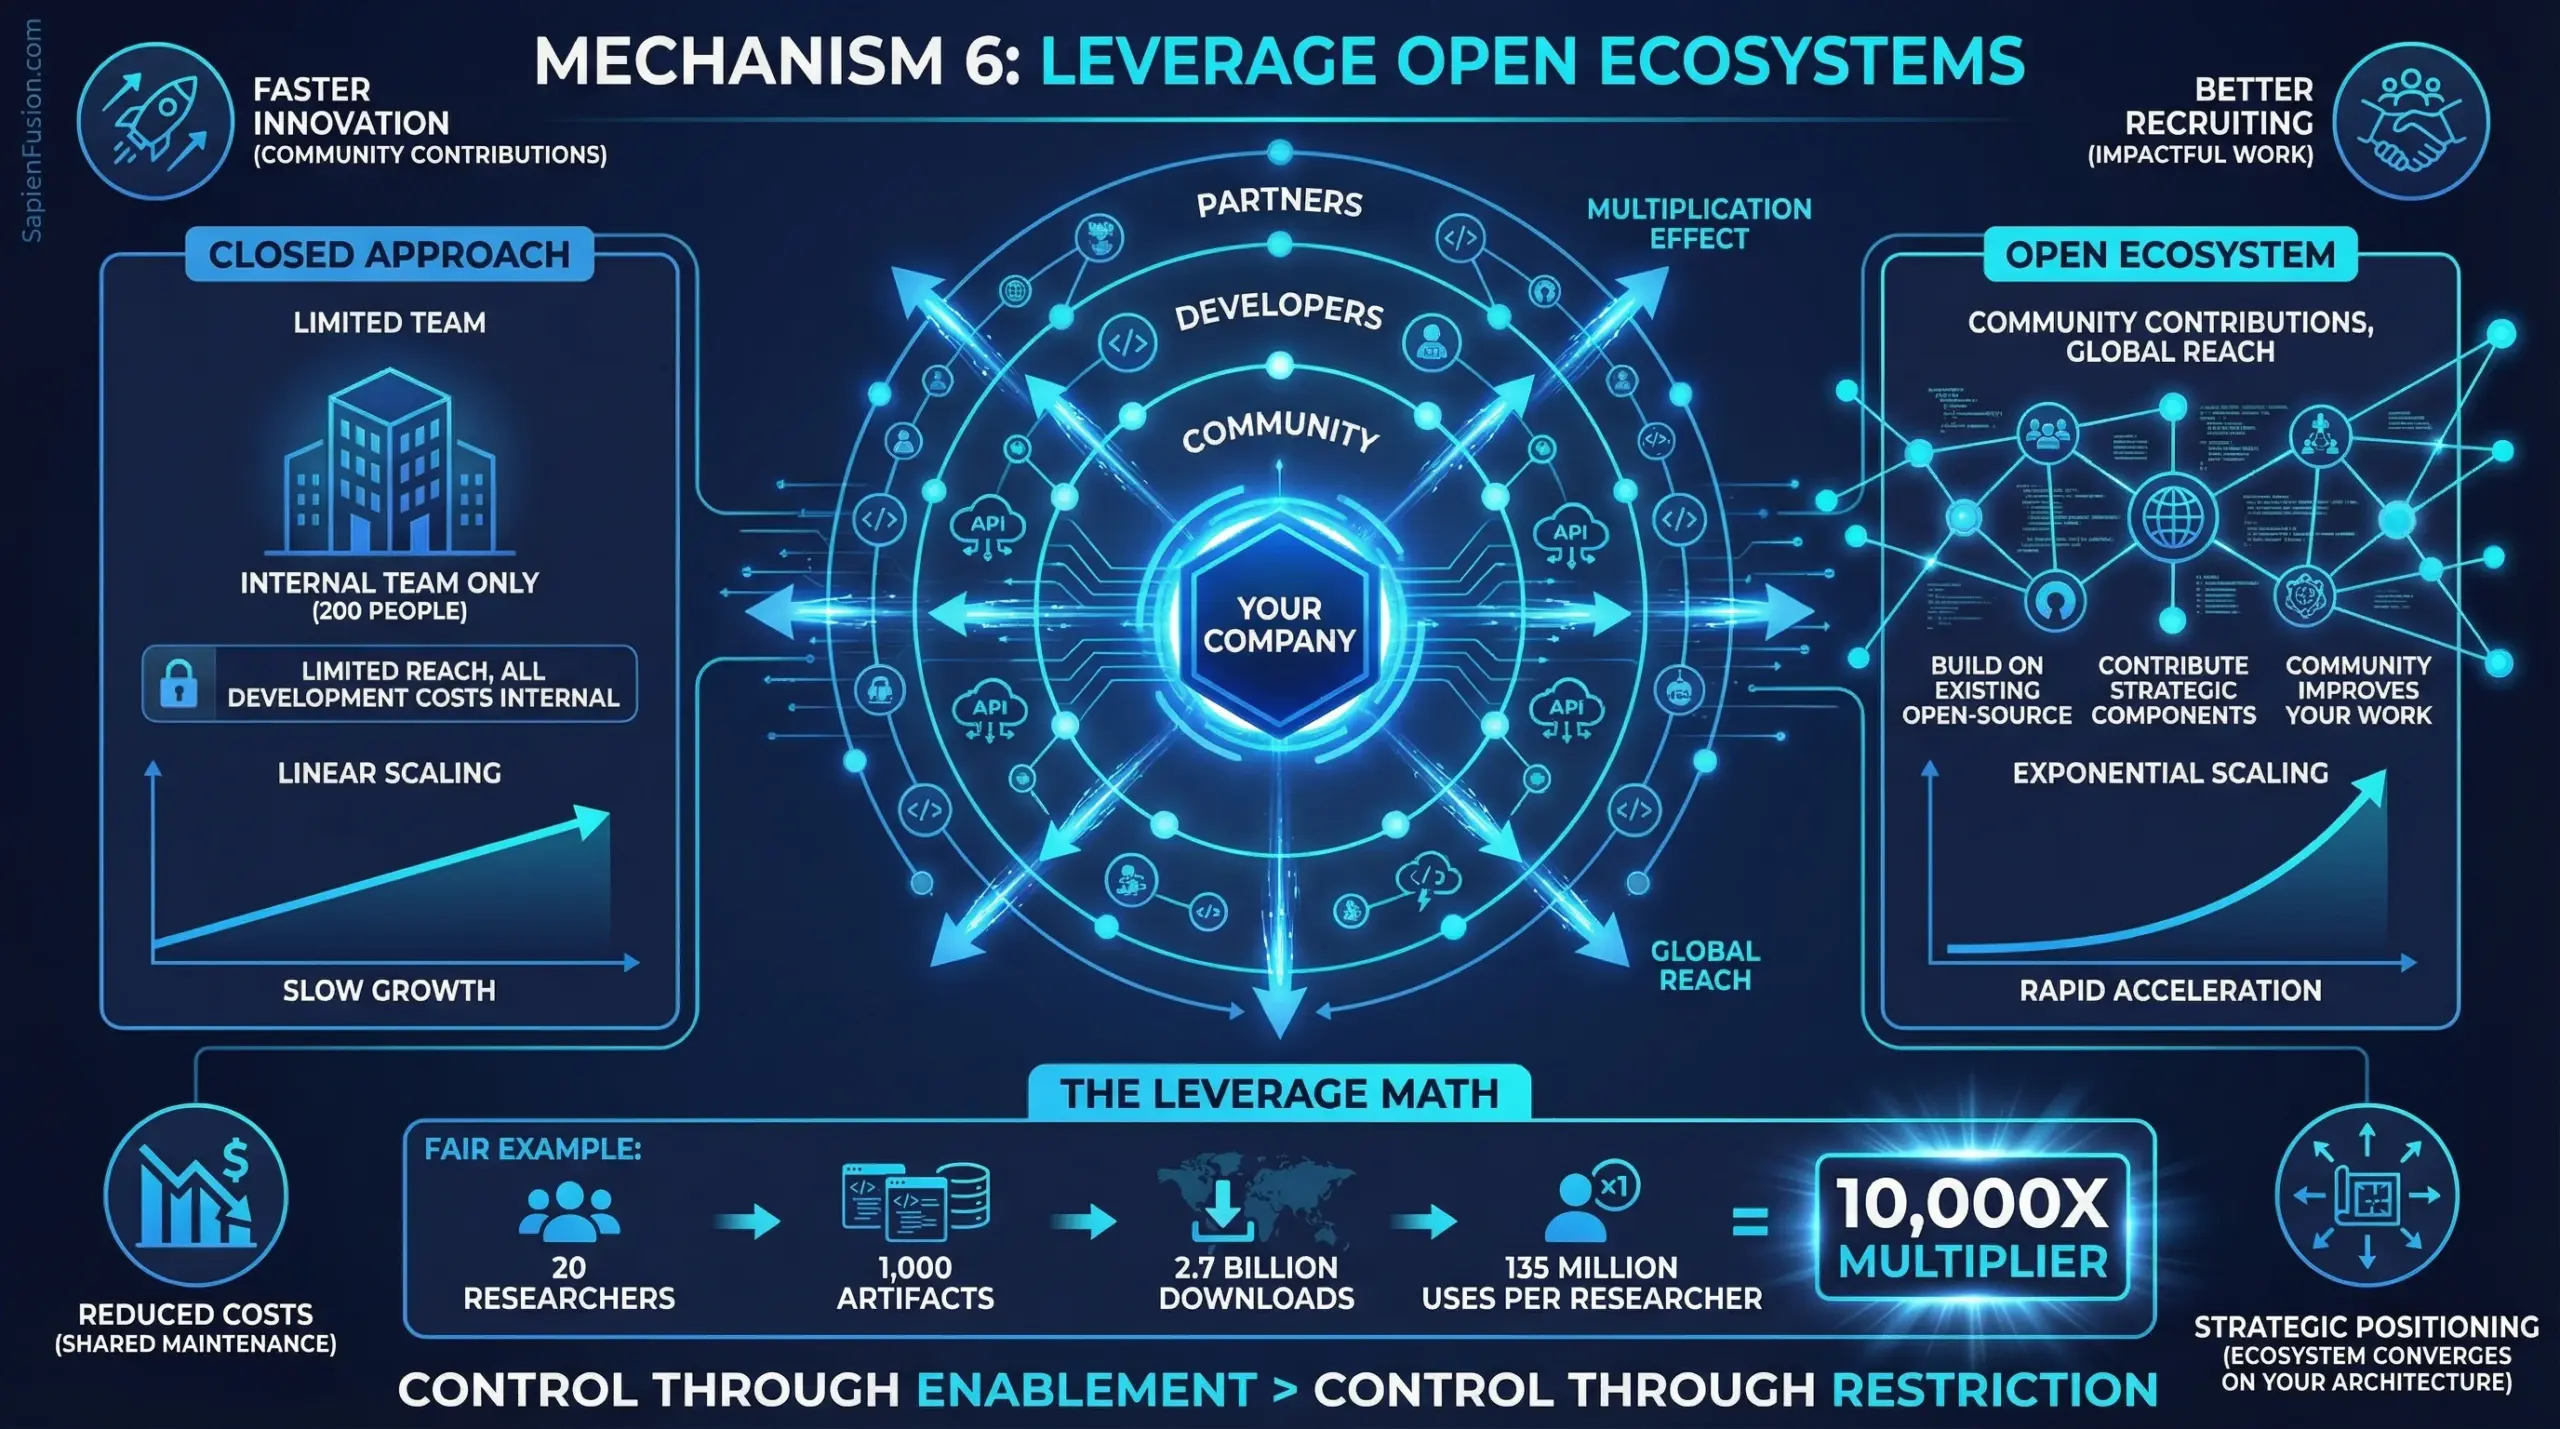
6. Leverage Open Ecosystems to Multiply Capabilities Without Proportional Cost
The Pattern: Building on existing open-source tools, APIs, standards, and community contributions eliminates duplicated effort across the industry and multiplies capabilities through collaboration rather than internal development.
Case Studies:
Meta AI/Mila (PyTorch & Open Science): Under Pineau’s leadership, FAIR Montreal released over 1,000 research artifacts—achieving 2.7 billion downloads globally. PyTorch alone became foundational infrastructure for AI development worldwide, used by millions of researchers, developers, and companies.
The leverage math: 20-30 researchers at FAIR Montreal → 1,000+ artifacts released → 2.7 billion downloads = approximately 90-135 million leveraged uses per researcher.
This wasn’t charity—it was strategic ecosystem positioning. By establishing PyTorch as the standard framework, Meta ensured:
- Talent pipeline: New AI researchers trained on PyTorch, reducing onboarding friction
- Technical alignment: Industry converged on Meta’s architectural choices
- Ecosystem contributions: External developers improved PyTorch, reducing Meta’s maintenance burden
- Recruiting advantage: Top researchers attracted to organizations releasing impactful open-source work
Compare to closed approaches: OpenAI and Anthropic keep most research proprietary, limiting impact to internal use plus API customers. Their researchers’ work benefits hundreds of thousands. FAIR’s researchers’ work benefits millions—without proportional increase in headcount or budget.
insitro (Open Datasets & Reproducibility): While insitro’s core platform remains proprietary, Koller strategically releases selected datasets and participates in reproducibility initiatives. This positions insitro as a credible partner for pharma collaborations worth $2B+ in potential deal value.
Pharmaceutical companies trust partners who contribute to field-wide knowledge, not just protect IP. Strategic openness signals scientific rigor and positions insitro as infrastructure provider rather than competitor threatening to capture entire value chain.
World Labs (Building on NeRF Foundation): Fei-Fei Li’s World Labs built on open research foundations including Neural Radiance Fields (NeRF), 3D Gaussian Splatting, and computer vision architectures developed by the academic community over decades.
Rather than reinventing 3D rendering from first principles—which would require tens of millions in R&D—World Labs leveraged existing breakthroughs and focused differentiation on spatial intelligence training at scale. The founding team includes Ben Mildenhall (co-inventor of NeRF), ensuring direct access to foundational techniques.
This compressed development timeline: concept to commercial Marble platform in less than two years, reaching $1B+ valuation by September 2024. Compare to competitors developing proprietary 3D approaches from scratch, burning capital on problems the open research community already solved.
Diligent Robotics (ROS & Robotics Ecosystem): Moxi robots likely leverage Robot Operating System (ROS) and related open-source robotics infrastructure rather than building fundamental navigation, mapping, and control systems from scratch. This enabled focusing capital on Diligent’s differentiation: social intelligence and hospital-specific navigation challenges.
The unit economics reflect this leverage: $725K NSF grants funded development because Thomaz could focus grants on novel social robotics problems rather than reinventing solved challenges. By the time Diligent raised venture capital, they were scaling proven hospital deployments, not funding basic robotics R&D.
Actionable Framework:
Strategic Open Source Decisions:
What to Open Source:
- Infrastructure components with network effects (frameworks, standards, protocols)
- Research that establishes scientific credibility (papers, benchmarks, reproducibility tools)
- Commoditized capabilities where differentiation comes from integration (data connectors, API wrappers)
- Problem domains where community improvement strengthens ecosystem (security tools, accessibility features)
What to Keep Proprietary:
- Core differentiation that compounds with usage (trained models, proprietary datasets)
- Capabilities requiring expensive infrastructure (large-scale training, specialized hardware)
- Integration knowledge from deployment experience (operational playbooks, customer workflows)
- Strategic partnerships and data access (exclusive relationships, competitive moats)
Decision Matrix:
| Factor | Open Source | Keep Proprietary |
|---|---|---|
| Network effects strong | ✓ | |
| Competitive differentiation | ✓ | |
| Recruiting/credibility signal | ✓ | |
| Infrastructure with marginal cost near zero | ✓ | |
| Compounding data advantage | ✓ | |
| Community improvement valuable | ✓ | |
| Expensive to maintain alone | ✓ | |
| Direct revenue source | ✓ |
Ecosystem Leverage Strategies:
1. Strategic Standards Participation: Contribute to standards bodies and open protocols in your domain. Companies influencing standards capture disproportionate value as ecosystem converges on their architectural choices.
Examples:
- Meta with PyTorch defining ML framework standards
- Pineau’s ML Reproducibility Checklist becoming field-wide standard
- World Labs potentially influencing spatial intelligence APIs as category emerges
2. Open Core Business Model: Release foundational capabilities as open source while monetizing:
- Enterprise features (security, compliance, support)
- Managed services (hosting, scaling, operations)
- Premium datasets or trained models
- Integration and customization services
This captures value from ecosystem adoption without limiting growth through proprietary restrictions.
3. Research-to-Product Pipeline: Release research results publicly to establish credibility and recruit talent, while keeping productization and operational knowledge proprietary.
Meta AI’s approach: Publish papers and release research code, but keep production systems and optimization techniques confidential. Recruits top researchers while maintaining competitive advantage in deployment.
4. Community-Driven Development: Design systems where community contributions improve the platform, reducing your engineering burden while expanding capabilities.
PyTorch model zoo: External developers contribute pre-trained models, expanding PyTorch’s value without Meta funding every model’s development. Similarly, Hugging Face built multi-billion dollar business by facilitating community model sharing.
5. Interoperability Over Lock-In: Design for compatibility with existing ecosystems rather than forcing proprietary standards. This accelerates adoption by reducing switching costs and integration friction.
Cohere’s approach: Cloud-agnostic deployment supporting Google Cloud, Azure, Oracle, and on-premises. Enterprises adopt faster when they’re not locked into single vendor.
Capital Efficiency Implications:
Traditional Approach:
- Build everything internally
- Maintain proprietary standards
- Keep all research confidential
- Result: High development costs, slower innovation, limited adoption outside controlled ecosystem
Ecosystem Leverage Approach:
- Build on open foundations, differentiate on integration
- Contribute to standards you want to influence
- Release strategic research to establish credibility
- Result: Lower development costs, faster innovation cycles, broader ecosystem adoption multiplying impact
The Open Ecosystem Paradox:
Giving away research and infrastructure appears to destroy competitive advantage. Yet the profiles demonstrate the opposite:
- PyTorch’s openness made Meta the center of ML ecosystem
- World Labs built on open research foundations to reach $1B valuation in months
- insitro’s reproducibility commitment enhanced pharma partnership value
- ML Reproducibility Checklist established Pineau’s thought leadership
The resolution: Control through enablement beats control through restriction when network effects and ecosystem dynamics dominate.
Open ecosystems create:
- Faster innovation (community contributions exceed internal capacity)
- Better recruiting (top talent attracted to impactful work)
- Strategic positioning (ecosystem converges on your architectural choices)
- Partnership opportunities (credibility signals through open contribution)
- Reduced costs (community maintains shared infrastructure)
When Ecosystem Leverage Fails:
Openness backfires when:
- No network effects exist (single-player domains)
- Competitors can directly monetize your work (weak IP protection)
- Development costs exceed community contribution value (niche applications)
- Strategic differentiation comes from proprietary methods (closed algorithms as moat)
Sequencing Strategy:
Phase 1 (Building Foundation):
- Leverage maximum existing open-source components
- Contribute improvements back to establish credibility
- Keep core differentiation proprietary
- Goal: Minimize development costs, establish ecosystem presence
Phase 2 (Establishing Position):
- Release strategic research demonstrating technical leadership
- Open source infrastructure components with network effects
- Maintain proprietary advantages in trained models, datasets, operational knowledge
- Goal: Become ecosystem focal point while preserving competitive moats
Phase 3 (Ecosystem Dominance):
- Drive standards in your favor through open contribution
- Enable ecosystem to build on your platform
- Monetize through services, premium features, or adjacent value capture
- Goal: Control through enablement rather than restriction
Measurement Framework:
Track ecosystem leverage effectiveness:
- Adoption metrics: Downloads, forks, implementations, citations
- Community contribution: External PRs, bug reports, feature additions
- Recruiting impact: Candidate awareness, application rates from ecosystem
- Partnership velocity: Inbound strategic conversations, collaboration proposals
- Competitive positioning: Market share of ecosystem vs. proprietary alternatives
The Capital Efficiency Thesis:
20 researchers releasing 1,000 open artifacts downloaded 2.7 billion times demonstrates ecosystem leverage achieving 10,000X+ multiplier compared to closed approaches.
That’s not altruism. It’s strategic capital allocation: invest in ecosystem infrastructure once, capture disproportionate value as ecosystem scales around your architectural choices.
Open ecosystems don’t dilute competitive advantage—they multiply impact and reduce costs when network effects and community dynamics align with your strategic positioning.
Cross-Cutting Strategic Implications
For Operators: Architecture Decisions Trump Capital Access
The Core Insight: Five of six profiles succeeded not by raising more capital, but by making different architecture decisions that turned constraints into advantages.
Practical Application:
When facing a well-funded competitor, ask:
- What are they betting must be solved? (Full autonomy, curated datasets, autonomous completeness)
- What happens if that bet is 3-5 years away? (Market opportunity captured by “good enough” solutions)
- What architecture achieves 80% of value without solving the hard problem? (Hybrid intelligence, unstructured data, social intelligence)
- Does our constraint force clearer thinking? (Limited capital → must validate demand first)
Case Study: Devanthro vs. Well-Funded Humanoid Robotics
Well-funded approach:
- Raise $200M+
- Hire top robotics researchers
- Solve autonomous manipulation in unstructured environments
- Timeline: 5-10 years to real-world deployment
- Risk: Technology may not be ready, market may not wait
Devanthro’s constraint-driven approach:
- Raise €720K (non-dilutive)
- Build hybrid intelligence (human + AI)
- Deploy imperfect system solving urgent problem (caregiver shortage)
- Timeline: 3 years to real-world deployment
- Risk mitigated: Customers pay for imperfect solution while autonomy improves
The better-funded competitors may eventually build superior autonomous systems. But Devanthro has years of deployment data, customer relationships, and revenue by the time competitors launch.
Decision Framework:
When to Compete on Architecture vs. Capital
Compete on architecture when:
- Core technical challenge has 5+ year timeline
- Customer pain is acute now
- Imperfect solution captures 80%+ of value
- Your architecture generates compounding data advantages
- Well-funded competitors are consensus-following
Compete on capital when:
- Winner-take-all market dynamics (network effects, regulatory capture)
- Speed to market is deterministic of success
- Approach is proven, execution determines winner
- Capital enables structural moats (exclusive partnerships, acquisitions)
For Investors: Capital Efficiency Signals Deeper Technical Insight
The Pattern Across Profiles:
Founders achieving breakthrough outcomes with limited capital typically demonstrate:
- Deep domain expertise (Koller: Stanford professor, Thomaz: MIT PhD + 9 years academic research)
- Systematic customer discovery (Thomaz: 150 hours shadowing nurses, Kharchenko: early public deployments)
- Technical clarity (Pineau: reproducibility crisis diagnosis, Li: ImageNet foundation)
- Constraint as advantage (Kharchenko: Ukraine crisis forced operational excellence)
This isn’t frugality—it’s precision. They know which problems matter and which technical approaches will work.
Investment Implications:
Red flag in pitch: “We need $50M to build the platform, then we’ll find customers.”
- Signal: Market risk unvalidated, architecture unproven
- Common outcome: Burn through capital discovering product-market fit doesn’t exist
Green flag in pitch: “We spent $500K validating demand with 5 customers. $5M scales to 50 customers with proven playbook.”
- Signal: Market risk reduced, unit economics demonstrated
- Common outcome: Capital efficiently converts to growth
Due Diligence Questions:
-
Capital efficiency history:
- “What did you accomplish with first $X?”
- “How did customer/technical learnings change the product?”
- “What would you do differently if starting today?”
-
Architecture decisions:
- “Why this approach vs. consensus alternative?”
- “What are you betting doesn’t need to be solved?”
- “How does your system improve with deployment?”
-
Constraint clarity:
- “What would you do with 10x more capital?”
- “What constraints forced your best decisions?”
- “Where does capital actually accelerate vs. just burn?”
Portfolio Construction:
Traditional approach: Back consensus plays with capital to execute faster than competitors.
Capital efficiency approach: Back differentiated architectures solving known problems with systemic validation before scaling capital.
The six profiles suggest a portfolio thesis:
- 30-40%: Consensus plays where capital determines winner (speed/scale advantages)
- 60-70%: Differentiated architectures with demonstrated traction (capital efficiency plays)
The latter may have smaller TAMs initially but higher probability of capital-efficient success.
For Policymakers: Government Funding Catalyzes Frontier Technology Commercialization
The Evidence:
Devanthro: €720K BMBF grants → real-world robotics deployment Diligent Robotics: $725K NSF grants → 1M hospital deliveries Meta AI/Mila: Institutional research funding → open-source frameworks used globally
Government funding enabled systematic de-risking before venture capital entered. This preserved equity for founders, reduced investor risk, and demonstrated commercial viability.
Why This Matters:
Frontier technologies (Physical AI, biotech, quantum) require:
- Long technical development timelines (3-5 years)
- Uncertain commercial applications initially
- High capital intensity for validation
Venture capital optimizes for:
- Fast growth (18-24 month milestones)
- Clear market validation
- Capital-light scaling
The Gap: Many breakthrough technologies die in the transition from research to commercial viability—too risky for VC, too applied for academic funding.
Government Funding Bridges This Gap:
Phase 1: Academic Research (NSF, NIH, DOE basic research)
- Fundamental discoveries
- Published papers
- No commercial pressure
Phase 2: Commercialization Research (SBIR, EIC, Innovate UK) ← Critical
- Market discovery
- Technical proof-of-concept in real environments
- Customer validation
- IP development
Phase 3: Venture Capital
- Scaling proven models
- Market expansion
- Infrastructure build-out
Without Phase 2 funding, breakthrough academic research struggles to demonstrate commercial viability needed for Phase 3.
Policy Recommendations:
-
Expand SBIR/STTR-style programs globally
- Current US model: $225K Phase I, $500K-$2M Phase II
- Success: Diligent Robotics, thousands of companies
- Gap: Other countries lack equivalent systematic commercialization funding
-
Create “deployment grants” for real-world validation
- Fund startups to deploy in operational environments (hospitals, care homes, factories)
- Require systematic data collection on performance, safety, commercial viability
- Bridge between research prototypes and commercial products
-
Reward capital efficiency in grant evaluation
- Track outcomes per dollar of government funding
- Highlight programs that preserve equity while enabling commercial validation
- Use success stories (Diligent, Devanthro) to refine funding criteria
-
Support open-source infrastructure development
- Fund platforms like Papers with Code that reduce industry-wide duplication
- Recognize that ecosystem-wide efficiency gains justify public investment
- Measure impact through adoption metrics, not just papers published
ROI Analysis:
Devanthro: €720K → Company deploying robots in homes, potential market in millions of elderly Europeans Diligent: $725K → Company valued at $75M+, addressing nursing shortage affecting every hospital Meta AI: Institutional funding → PyTorch used by millions, Papers with Code eliminating research waste globally
Government funding didn’t just help individual companies—it catalyzed entire sectors (hospital robotics, elderly care automation, reproducible AI research).
Synthesis: The Capital Efficiency Paradox Resolved
The paradox: Frontier technology appears to require massive capital, yet the profiles demonstrate breakthrough outcomes with limited capital.
The Resolution:
Capital efficiency in frontier technology comes from:
- Architecture that compounds (hybrid intelligence, ML-driven discovery, data flywheels)
- Deployment that teaches (real-world environments, imperfect systems, systematic learning)
- Demand that’s structural (acute problems, existing budgets, operational crises)
- Capital that preserves optionality (government grants, strategic investors, institutional resources)
- Constraints that force clarity (limited capital → must validate, limited time → must focus)
The Deeper Pattern:
Women leading these initiatives often faced capital constraints not by choice but by circumstance (fundraising challenges, non-traditional backgrounds, resource-limited contexts). Those constraints forced:
- Systematic customer discovery before building
- Technical approaches that work with less
- Business models that generate revenue earlier
- Partnership strategies that leverage external resources
When market conditions shifted (pandemic-driven automation demand, AI deployment urgency, reproducibility crisis), these capital-efficient architectures were positioned to scale while capital-intensive competitors were still building.
The Strategic Implication:
Capital efficiency isn’t about being small—it’s about being precise. The most capital-efficient path to frontier technology commercialization:
- Validate demand systematically (150 hours shadowing customers, not 150 slides projecting TAM)
- Choose architecture that learns (every deployment makes next deployment better)
- Deploy imperfect systems profitably (solve urgent problems while iterating)
- Preserve equity through government/strategic capital (demonstrate traction before institutional VC)
- Let constraints force better decisions (limited capital → must validate, not guess)
When Alona Kharchenko hung laundry with an 89-year-old woman using a €720K-funded robot, she wasn’t demonstrating a proof-of-concept. She was running a commercial deployment that generated training data while solving an acute care problem.
When Andrea Thomaz’s robot completed its millionth hospital delivery, it wasn’t celebrating a milestone. It was demonstrating that systematic customer discovery, government-funded validation, and architecture that learns can achieve operational scale that $73M consumer robotics ventures failed to reach.
Capital efficiency in frontier technology isn’t about making do with less. It’s about building systems that compound, deploying where learning matters, and preserving resources for the scaling phase when architecture and demand have been validated.
The paradox resolves: Breakthrough outcomes do require capital—but far less than consensus assumes when architecture, deployment strategy, and capital structure align.
This is Part 1 of 7 from The Capital Efficiency Paradox
All parts in this series:
- Part 1: Capital Efficiency Through Humanoid Telepresence
- Part 2: Building the First Longitudinal Women’s Health Dataset
- Part 3: $800M to Rebuild Drug Discovery
- Part 4: $230M to $1B in Four Months
- Part 5: From 20 Researchers to 2.7 Billion Downloads
- Part 6: Capital Efficiency Through Government-to-Commercial Path
- Part 7: The Capital Efficiency Playbook
- Research Methodology and Source Verification for the Capitol Efficiency Paradox Series